There are a few basic ways to trade equity shares. Some prefer to pour over fundamental data to evaluate the company’s worth and try to make an educated guess as to future growth. Often, this type of investing is in a longer term window.
Another type of trader will do little else than read the tape or transactions taking place. He or she may stare at a screen that spits out the bid, the ask, and the actual trades. Based on this numerical readout they will buy and sell… usually intraday.
The final type of trader will also use technical analysis tools. This person will examine price charts for patterns or indications of where the stock may go. It is this final trader that we will dedicate this next section to. But what is a stock chart?
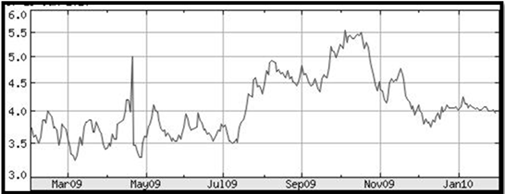
Put succinctly, a stock chart is price over time. The asset value is tracked over a span of minutes, days, weeks, or months.
Aristrocrat FPO (ASX)

Typically you will see the share price on the vertical axis (or sometimes called the y-axis), and the time period on the horizontal axis (or the x-axis).
Chart Types
There are a variety of chart types available which we will cover a little later in more detail. In brief, here are the major types you will commonly find:
The type of chart you choose will largely depend on the type of investor you are and how much information you desire. Some charts, such as the line chart, do not display the opening price, or daily range of trading. Other charts such as the Point and Figure do not display a time reference.
One other setting you should be aware of is if your chart will have logarithmic or linear scale. Often, people who use charts frequently prefer logarithmic as patterns since drawing trendlines are more reliable with this setting.
Chart Ranges
When customizing a chart, you will need to decide the length of trading data to display. If your goal is to buy and hold over many years, no doubt you will be interested in a much longer time frame that spans years. If you are a day trader, perhaps you will only be interested in charts of 10 days or less.
A good rule of thumb for any trading style is to start with a very broad time frame and slowly hone in on the specific trading window. This will enable you to get a feel for the big trend as well as the short term action.
Without further ado, let us begin our chart lessons by studying the most simple and easy to read form or chart: the line chart.
Charting Articles
- Line Chart
In the world of charting, the line chart is the most basic and easy to read. Line charts can be used by investors just learning to use charts, or by someone who only wants a passing glance at the chart without the extra details.
- Bar Chart
The bar chart is one of the most commonly used stock charts. The reason for this is that it contains a wealth of information about price action while keeping the chart uncluttered and easy to read. This is what two bars look like
- How to Read a Candlestick Chart
The Candlestick Chart is one of the most popular Trading Charts. Learn How to Read a Candlestick Chart and identify and use Candlestick Patterns
- How to Read Point and Figure Charts
While computer charts can easily create flashy charts, there are some distinct advantages to the Point and Figure charts. In this lesson you will Learn How to Properly Read a Point and Figure Chart.
- How to Draw Trend Lines on Stock Charts
The concept of a trendline is a simple one: connect two points together with a line. Correctly drawing it requires a bit more skill. Below are the rules to drawing a proper trend line.
- What are Stock Gaps & How to Trade Them
When prices jump right up through a trading range this is called a gap-up. Learn the four major types of gaps and the numerous ways to trade them.
- How to Read & Trade Chart Patterns
A chart pattern is simply a recognisable trading formation with a predictable outcome. Learn how to read the most common chart patterns and how to trade them including Ascending Triangle, Descending Triangle, Cup, Double Bottom and Head & Shoulders