This next article will discuss one method for trading with the trend. Does this sound familiar? We have likely heard the advice to ‘follow the trend’ over and over again because it works. Why is ‘trend trading’ good advice for beginners (or even experts)? Share prices generally trade in waves, or a direction, for an extended period of time – therefore trading with the trend gives you higher odds of a profitable trade. While trends do eventually reverse, there are far more bounces with the trend than there are reversals that break the trend. When you see share prices beginning to trade against a trend it is safer to assume a pullback than to jump to the conclusion that you have a reversal and prices are about to do a 180.
For ‘trend following’, I recommend using a 5 minute candlestick chart – if not a
longer time frame. If you use too short of a time frame you will encounter a lot
of ‘trading noise’. This is the playing ground of high frequency traders and there
are many head-fakes to beware of. Can you find ‘baby trends’ and patterns on a 1
minute chart? Sure. But if you try to time the lapping waves without watching the
tsunami coming in you’ll drown in the inevitable loss. As a general rule, take most
of your trading cues from the 5 minute chart – although we will use the 1 minute
chart for other purposes.
On the 5 minute chart, wait for enough bars to form so that you can draw a simple
trendline. This often takes 30 minutes to 2 hours. How do you draw a trendline?
Again, I will keep it simple.
- Trendlines are drawn under the price for an uptrend (think of it as supporting
the price)
- Trendlines go above the prices for a downtrend (think of this as holding
prices down)
The chart below is Citigroup which is gapping lower in the morning
trading session (left side of chart).
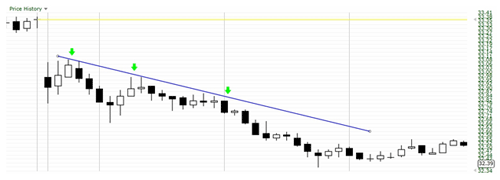
After the first 15 minutes (3 bars) the prices peak around $33.09 before dropping
lower. Now if you were waiting for an entry, the fourth bar (a black one) went lower
than the previous bar (two bar trading signal). But perhaps you wanted to wait until
a trend was properly established before buying. After one hour (the 2nd green arrow)
you can now draw a trendline on top of prices. The 11th bar (first black bar after
the 2nd green arrow) could be another entry point as it takes out the low of the
previous bar.
A third time we see prices touch our line(at the third green arrow) and prices drop
even lower. In general try to find the bigger trend on the 5 minute chart and enter
your trade when prices make pullbacks. As in the chart above you want to watch this
stock when it makes a pullback (prices go up if the trend is down) and then short
using your trading trigger when prices take out the low of a previous bar. This
is a simply method to trade the trend using a trendline and our two-bar entry rule.
But what is one simple exit rule when using trendlines?
Simple Trendline Selling Rule
Entering a trade is the easy part but knowing when a trend is spent is much more
difficult. You will question whether the pullback is simply a correction or a reversal.
When do you sell?
When your trendline is seriously breached as prices trade through it – get out of
the trade. What do you do then? You should sit and watch to see what happens next.
- Will the stock trade sideways and then trade down again?
- Will you have a new uptrend?
It is difficult to know what the stock will do so simply stay out until you can
determine a new trend with a new trendline – which may be up or down.
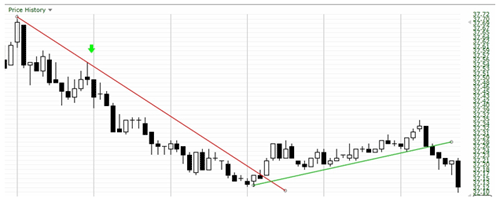
The chart directly above is Time Warner (TWX). After the first
hour or so of trading you are biased towards a downtrend. Remember that you must
draw a line on top of the share prices and extend it as far as you can. At the green
arrow you short the stock as the next black candle falls down past the preceding
black candle (the black bar touching the red trendline and the bar that falls past
it just afterwards.).
- You short the stock at $37.46.
- You ride this stock down waiting for the trendline to be significantly breached.
- Over 3 hours into the trading day (2 hours from when you started the trade), prices
break above your downward trendline.
This is a signal that the trend is weakening and you need to get out. You will likely
not be covering on the black candlestick with that tiny wick that barely poked its
head above your trendline (black bar with wick above the red trendline). This could
be another pullback followed by another move downwards. The bar directly after it
– the longer bodied white candlestick that is wholly above your downward trendline
- is the one you will be covering your position in. Somewhere in the middle of this
bar is your exact exit. The middle of the white candlestick trades at a price of
$37.19. You thus get a 27 cent move for your two hours of trading which is $27 for
every 100 shares you put in.
What do you do next? Sit and wait to see what happens next. Will a new uptrend form
or will the stock trade sideways before resuming a downtrend? After 45 minutes or
so you discern that a new uptrend is in effect and you can now draw a new upwards
trendline (green in the chart above). You are welcome to buy into this trendline
provided that prices stay above it. As prices fiercely break below the trendline
(near the end of the chart above) you get out of your trade and wait for another
setup.
Trend Trading Google (GOOG)
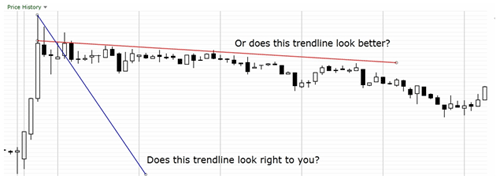
The chart below is the well-known stock Google. I am about to draw a trendline in
a certain way that some chartists will frown upon. I am drawing trendlines right
through the wicks or shadows of the candles. Why am I doing this? Because you won’t
always have a perfect chart (almost never) and if you insist it, you will just drive
yourself mad. Try to make a trendline where it makes the most sense and where it
fits the best while obeying most of the rules for drawing trendlines. Sometimes
it will be on top of the wicks and other times it won’t. Prices may shoot up briefly
past your trendline and get forced right back down again. Should this 30 second
anomaly determine the way you draw a trendline for the next 4 hours of trading?
Maybe…but probably not, and especially no if it was a spike on low volume. Just
try to make your trendline a ‘best fit’ and where it makes the most sense. In general,
if a trendline is steeper than a 45 degree angle, you should treat it with suspicion
(although the steepness of your trendline depends on how your chart is setup or
how many candles per chart you allow). As well, you often need to ignore the first
5 or 10 minutes of volatile trading since this is not an accurate representation
of the day’s trading. It is often a fast and furious speculative scramble which
will normalize later on.
Here is a review of the basic principles for entries and trend bias:
- Buy when the high of the current bar breaks above the high of the previous bar
- Short when the low of the current bar breaks below the low of the previous bar
- To form a directional bias you usually will want to wait for enough trading to establish
a trendline (15 minutes or longer)
- In general, enter when prices pullback to the trendline area (but remember the first
two rules on when to enter the trade or the exact trading trigger)
- If your trendline is severely broke you should exit the trade
Armed with directional bias and the two bar rule for entering a trade – look at
some of the charts below. Are you generally on the right side of the trade using
these basic guides?
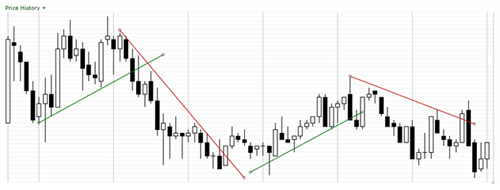
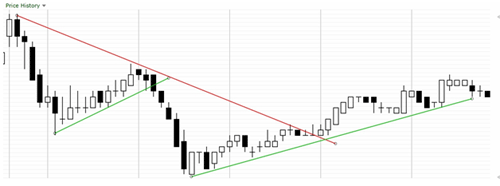
The chart above shows you don’t always have long-term and smooth trendline. Sometimes
you can only figure out the trend right before it reverses and trades the other
way. This is a frustrating experience as you keep showing up late and having to
exit. But remember that you only want to buy when prices go above the previous bar
high and you only short when prices drop past the previous bar low – so this may
help you stay out of a reversal. This sort of whip-sawed trading may get ugly and
you need to think quickly and be decisive.
The chart above is highlighting trends within a trend. Should you play the larger
downtrend or the smaller uptrends? We will cover this in the more advanced setups
in a later article series. If you want to skip ahead it is the articles on channeling.
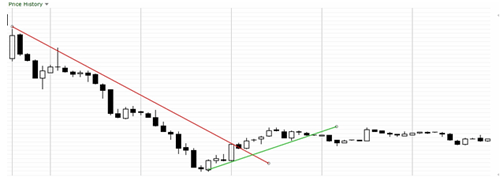
The chart above is Walmart (WMT). There are times when you cannot
easily draw a trend - such as in the right half of this chart. At times the market
is trending and other times it is not. If you have too much difficulty drawing a
clean trendline or prices keep slicing up and down through it as if it wasn’t there
– don’t start trading. You might learn how to trade this sort of volatile action
later on but for now stick to trending stocks that appear to obey the rules of the
trendline.
You also might start to notice something else on the charts – trends usually go
in two or three thrusts before weakening and reversing. If you are showing up to
the party on the third thrust – be cautious that the trend is not fully spent.
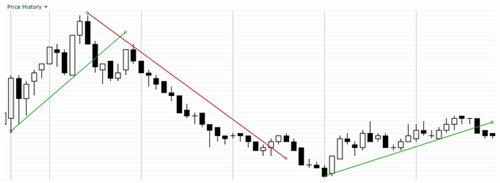
The above chart is Oracle (ORCL). Keep in mind that when using
trendlines you usually have to wait 15 – 30 minutes or longer for the trend to reveal
itself. Thus, you will not be trading at the beginning of the trendlines that I
have drawn – you won’t even know which direction to draw a trendline for the first
half-hour in most cases. There are other methods to create a directional bias sooner
than the trendline method which will be covered in another article.
With these bias and trigger rules you can start looking at real-time charts and
imagining when you would enter and exit based on a 5 minute chart. Better yet, you
can get a demo of a trading platform to paper-trade which usually has delayed quotes
– but this will not matter for practice. Either way, get some early experience using
the simple rules learned thus far so you feel comfortable drawing a trendline and
jumping in a trade when it pulls back to the trendline as it gears up for another
potential bounce.