The following article will be divided into two parts and will explain the precise moment when you should pull the trigger and enter a position either long or short. However, this is a trading trigger only and you should read the full series of articles before you start trading.
Triggers and Bias
Two major factors must be considered before entering a trade: bias and trading triggers.
- Bias is where you have an opinion on the direction of the stock. That opinion can change in one second but you need to know whether you are will buy or short shares. That direction of the trade is your bias.
- The second aspect is the actual trading triggers as to when you will buy or short at the earliest point possible with the least amount of risk.
Before we get into trading triggers and forming a bias we need to be on the same page. Everyone should know how to read a candlestick chart so we will have a very basic tutorial below. If you are looking for some in-depth coverage of candlesticks I would recommend reading the free tutorials at StockCharts. The following will only provide rudimentary knowledge that is absolutely necessary for the setups in this manual.
Candlestick Bodies

Candlesticks come in two basic colors – white and black. White means that prices have went up and black means prices have dropped.
- The white candle has prices opening at the bottom and closing at the top.
- The black candle has prices opening at the top and closing at the bottom.
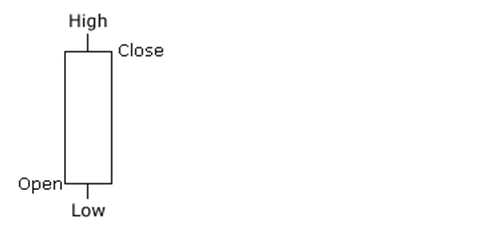
This is true regardless of whether a candle represents one minute or one year of trading. But what if a stock opened at $1, fell to 75 cents, bounced up to $2.25 before closing at $2? What would the candlestick look like then? It looks like a candle wick.
Candle Wicks or Shadows
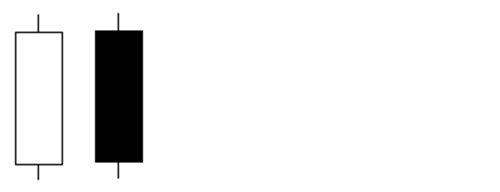
The points at the top and bottom of the candles show the range of trading. The white or black body tells you the opening and the closing price in addition to the direction of the trading – up or down.
Armed with the candlestick basics we can move back to trading. Before we discuss forming our directional bias in later articles, I want to discuss a trading trigger that you can use in virtually any time frame. I deal with triggers first as this one rule should lower your risk while day trading. If this is the only thing you remember when executing orders, the odds are that you will at least break-even at the end of the month.
Basic Entry Rule #1
When buying, make sure the candle you are trading is higher than the candle before it. In the diagram below, when is the earliest I can buy? Which candle can I buy?
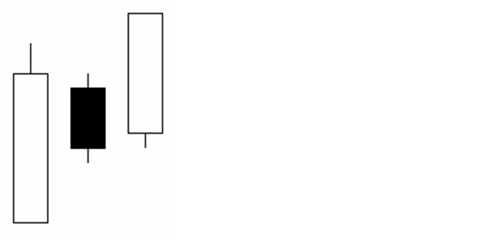
Well you can’t buy the first white bar since we don’t know what the previous bar looks like. The second black bar never rose above the high of the first white bar. We can buy on the third bar as it rises up past the highest point of the second black bar. The moment it trades one penny higher than the high of the last bar we buy.
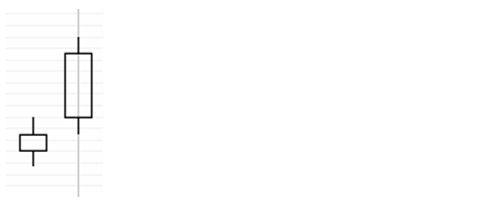
In the above example we have a white candle with a short body followed by a second white candle with a longer body. The moment the second candle rises above the wick, or the peak of the first candlestick, we buy. In real life the first candlestick had a high of $12.50 so we buy when the second candlestick reaches $12.51. Prices continued to rise up to $12.55 in the last white candlestick.
Remember that this is a precise trading trigger and it is not a setup and we do not yet have a directional bias. But it is one of the most valuable tips I can think of that most books gloss over – at least that was true when I was learning to trade. The chart below shows why this trading trigger is a good way to lower risk and increase your odds of entering a winning trade.
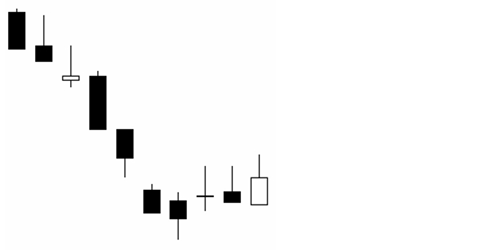
The diagram above is Google and each bar represents 5 minutes of trading. The first 7 bars show prices falling over $2 in the space of roughly half an hour. If you followed this rule, when is the earliest you could have purchased shares or went long in the stock? The 8th bar that looks like a cross (called a doji) is the first bar that has a peak higher than the previous bar. Now it may or may not be a good time to buy but at least it kept you sidelined when prices were quickly moving down.
This next chart is Apple with 1 minute bars. What is the earliest candle you could enter (long) using this one simple rule?
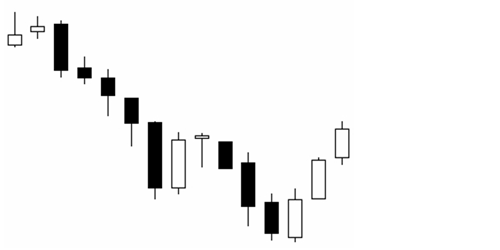
The tops progressed lower and lower until the third from the last bar. This may or may not be a great time to buy but you would not have been trading long during the disastrous fall that would have lost you $300 in 12 minutes if only trading 100 shares.
If you want some practice with this technique head over to freestockcharts.com and use 1 minute and 5 minute candlestick charts. You may still get some lackluster entries but notice how rare it is that you buy during freefalls which last for a few minutes to an hour. You will increase your odds of buying when the stock is heading in the right direction with this simple trading trigger. This is our first trading trigger when day trading: wait for the current bar to rise above the peak of the previous bar. Next we will discuss how to flip this rule when entering a short position.