This is part 2 of the intermediate setups and bias creation series of intra-day trading. Click here for Intermediate Setups and Creating a Bias Part 1
By now you are gaining quite a few trading skills are able to make some profitable trades. We know our trading trigger is when prices advance above the previous bar (enter long) or when the fall below the previous bar (enter short). We draw trendlines to better understand the trend so as to trade with it and we sell when this trend is broken. We have considered how to create a very short-term bias using the 10 and 20 period moving averages on the 1 minute chart.
We can also, however, use those same 10 and 20 period moving averages on the 5 minute chart to identify profitable trading zones.
Moving Averages and the 5 Minute Chart
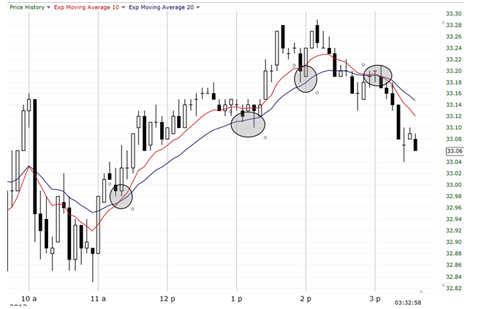
In a quick moving trend, the 10 period ema on the 5 minute chart can often be a ‘stall zone’. A secondary stall zone is the 20 period ema in the 5 minute chart. How does this work?
Consider a stock that is jumping up fast – too fast to be sustainable. It needs to pullback or correct slightly before advancing again. How far will it pullback? Often the pullback is to the 10 period ema on a 5 minute chart. The stock hits this level, finds support and resumes climbing. Then the stock falters once more and pulls back – this time to the 20 period ema. It holds and prices shoot back up.
It is important to understand that prices go up in waves – they do not shoot straight up like a rocket for extended periods of time. Sometimes they pullback to the beautiful trendline you drew and other times they pullback to the 10 or 20 ema. It all depends on the ferocity of the trend.

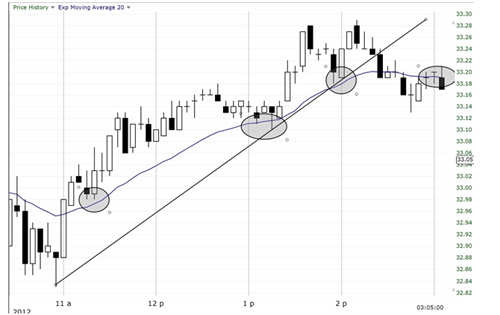
I drew circles around the areas where prices bounced off the 10 or 20 ema on the 5 minute chart. Now I am not going to spend a lot of time on this as I don’t find these levels useful when taken out of context. I would never trade solely using these moving averages but I do use them in a trade as potential zones where prices might find support from. I don’t want you to have overly complicated charts since it will detract from the price action trading. If you find it too distracting you are welcome to take these moving averages off your 5 minute chart. If you can only handle one of these – use the 20 period ema. The 10 generally works better in the morning during the volatile trading session but after the first hour I find the 20 ema works a bit better. Notice in the chart below how the 20 ema gives us two bounces almost exactly at our trendline.

As I look at the prices moving up from 11 to 12:30 I wonder how far prices might pullback before the next possible bounce up. The 20 ema gives me one possible zone. When prices start hitting the 20 ema I get ready to draw my trendline. This is a bit of an art instead of a science. Once again, it just helps you create a bias as to what prices ‘might’ do. It helps fine-tune your gut. If you don’t like it, just remove and trade without it.
To re-cap, you can use the 10 and 20 period moving averages on the 5 minute chart to find zones that prices might fall back to when correcting. Watch for price strength at these zones. If you have other reasons to believe that the stock will resume its trend, these zones can give that extra boost of confidence to jump in the trade.