Trading Contracts For Difference (CFDs) is not some game like Roulette where you make bets and spin the wheel with high hopes. Regardless whether you are trading short-term or investing for the long haul you need to be judicious when selecting shares and use proper money management techniques to control risk. Here is a recent example of a CFD trade.
CFD Trading on Flight Centre (FLT)
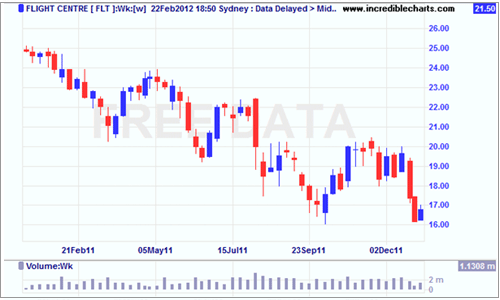
Flight Centre Ltd is a solid company that was entering deep value territory at the time of entry. In January 2012 the share price was less than revenue per share. The price to book ratio was also significantly less than the industry average. On the price chart, shares were at a previous support level. The chart below has each bar representing one week of trading.

Based on this being a solid company and prices bouncing off support, the entry point just above the $16 level seemed right. Looking at this chart we would sell if prices broke down significantly past the $16 range and we hope that shares will at least bounce up to the $20 range before encountering some resistance.
We will buy on January 10th, 2012 at a price of $16.85. Based on the support level of the chart we will set a stop-loss of $15.70. Is this a good risk/reward trade? Considering that we stand to gain $3.15 on the upside but are willing to lose $1.15 on the downside we have a risk to reward ratio of 1:2.7. You should always ensure that you stand to gain more than you are willing to lose.
But how will we manage our money and risk on this trade?
The 2 Percent Rule
According to the 2 percent rule we never risk more than 2 percent of our capital on any trade. We have a float of $15,000 and 2 percent of that is $300. This is the most we are willing to lose on our trade.
Calculating Position Size
We know that our stop-loss will be $1.15 below our entry price ($16.85 - $15.70). The brokerage will charge us $7 per trade. We are only willing to risk a total of $300. With these figures we can calculate our position size.
First thing first we subtract $14 for the cost of buying and selling from our $300 of risk capital.
Next we divide this number by the amount of share price loss we are willing to accept before our stop-loss forces us out of this trade. So by dividing our remaining $286 of risk capital by the $1.15 per share we are willing to accept as a loss, we will discover our position size.
- $286 / $1.15 = 248 shares
In this instance we will round down as we do not want to accept a penny more of risk than 2 percent. We have a position size of 248 shares and if our stop-loss is hit we will lose $300.
CFD Leverage and Capital Requirements
We are willing to risk $300 but we need to calculate more than that to place our trade. CFD trading utilises leverage and through our broker we need 12% margin to place this trade. How much is the total position is worth and how much capital do we need to cover the 12% margin?
- 248 shares x $16.85 = $4178.80 total position value
- $4178.80 x .012 (12% margin) = $501.46
Thus we enter the trade with $501.46 and we are willing to lose a total of $300. Again, what is our upside on this leverage trade? With a $20 potential target we could sell our shares for a gross profit $767.20 profit before daily margin costs but after transaction fees.
Flight Centre Price Action

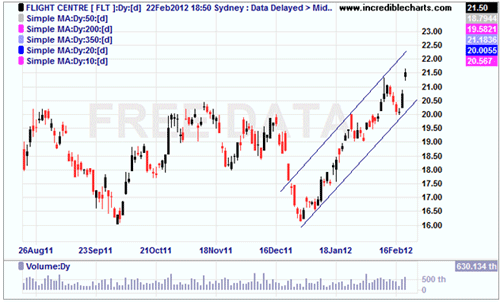
As you can see in this chart Flight Centre has popped up nicely and even flew past our price target of $20 on strength. Some recent positive earnings news caused the last little gap up in the chart. So far prices are channeling up strongly. Of course, we need to either make a new profit target or use some sort of a trailing stop-loss so we know when to sell.