For those unfamiliar with CFD’s, or Contracts For Difference, they are the equivalent to buying stock with margin. Let me rephrase that… it is like buying stock with a massive amount of leverage. Often, you will only need to deposit 5 percent of the trade as margin, which means you get 20 times the leverage as the asset holder. They are called Contracts For Difference because you do not really own the stock, you merely profit(or lose) from the change in price, or the difference in value between when you purchase and when you sell.
They are contracts that do not have a time expiration date like options do. This doesn’t mean you will want to buy and hold indefinitely though since they do have daily overnight financing fees that is usually the central banks rate plus a couple percentage for the middle man.
Although leverage can back fire on you, as any trader who has received the never welcome ‘margin call’ will tell you, there are also many perks to trading CFD’s.
- Ability to trade precious metals, currency pairs (Forex), international stocks, indices, and more
- Can trade long and short
- Can acquire dividends when owning a long CFD
- Can acquire daily interest when short a CFD
- Generally lower commissions than other products
- Tight bid and spreads as compared to options
- Could get better liquidity than share holders depending on CFD provider
Trading a CFD profitably requires a careful risk management plan. We need to systematically look at CFD’s in bite-sized portions to develop an overall system that should make us money.
Step #1: Formulate a Plan
Interestingly enough, if you asked a group of random CFD traders if they had a plan, most would tell you yes. Ask what their plan is, however, and you might see a lot of head-scratching, and a vague idea of ‘buy low, sell high’, or ‘double my money’. These are not plans or strategies and can be termed nothing more than wishful thinking.
As wise investors we should always have a plan. In fact, the higher the risk and the more leverage the more carefully laid out and proficient the plan should be. Here are some fundamental necessities when forming a plan.
- Investing with the market trend
- Picking the right stock
- Allocating the correct amount of capital for each trade
- Timing the entry
- Having stop-losses in place
- Profit taking strategy
Now that you have your checklist of necessary criteria, we will jump to the next step, investing with market trend.
Step #2: Determining Market Trend
A trader can improve his odds of a winning trade by three-fold with this simple rule: trade with the trend. If three out of four stocks are going upwards, your odds are better that you will pick a stock that will trade up. When three out of four stocks are dropping, you have a 75 percent chance of losing if you decide to trade long. The trend is your friend and you should trade with it. How do you determine market trend?
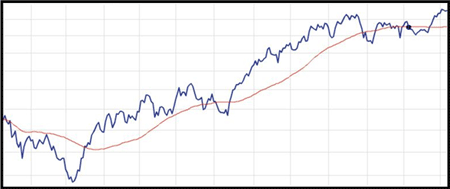
While there are numerous and convoluted ways to determine trend, try this simple approach used by many large institutional investors: buy when the index is above the 50 day moving average and trade short when the index is below the 50 day moving average.
We will pick the ASX 200 index as our market indicator. A simple 50 day moving average will be overlaid.

Each gridline on the horizontal axis is one month. To be on the safe side, wait for the index to remain above the 50 day moving average for 7 or 8 trading days to ensure a trend is in place. The same is true when the index falls below the 50 day moving average (red line). While you can be quick to liquidate your long positions, do not take up a bearish stance too quickly. Wait 7 or 8 days of the index trading under the 50 day moving average before you start to short with CFD’s.
Step #3: Picking the Right Stock
Generally speaking, people who trade CFD’s are looking for short term price movements instead of a long term buy and hold strategy. While fundamental analysis might be suitable for a long-term stock holding strategy, it may yield few results for a trading window of a few days.
To pick a stock suitable for technical analysis, a few things may be required.
- Choose a liquid stock that trades at least 100,000 shares daily. Illiquid stocks may have wild price movements that make analysis tricky. Also, the more liquid the stock the less likely someone is manipulating it to sucker you in.
- Even if you can find CFD’s on low priced shares with a Market Maker, it is best to trade stocks in the two to three dollar range and above. One advantage of the CFD is that you can trade high quality stocks with massive leverage. The more well known a stock is, the more predictable it may be for analysis.
- When trading long, try to pick a stock with high relative strength. This means that the stock has greatly outperformed the market over time. These stocks will often soar above their peers in an up market.
- When trading short, pick a stock with low relative strength. These companies greatly underperform the market. This means that if the market drops a little, these shares may drop a lot!
Screening for appropriate volume, price, and relative strength can usually be performed with the help of an automated screener.
Step #4: Deciding on Capital to Trade
How do you decide the amount of capital you are willing to put forward on each trade? Some traders will put tiny sums on trades they are unsure about while placing large amounts of capital on a CFD they have more confidence in. I do not recommend this type of strategy for the following reasons:
- You should never trade unless you have a measure of confidence
- The amount for each trade should be fixed so emotion does not take over
Remember, we need to trade with an iron will and keep our mania and anger to a minimum. There are two methods to allocate capital that we will discuss.
- The two percent rule
- Fixed capital trading
With the two percent rule, the system is basic. Risk only 2%of you capital per CFD trade. If you have $10,000 to invest then make sure that the maximum you'll lose on a CFD trade be no more than $200. This way you can have a run of 10 losses and would only consume 20% of you captial. As well, most people could walk away from a few of these small losses without turning green, ripping their clothes apart, and giving the computer a Hulk Smash! Acceptable losses will help you trade with a clear mind and without hesitation when the next opportunity arises.
The fixed capital trading rule applies when you are trading an extremely large amount of capital or very little. You simply choose the fixed amount you wish to spend on each trade. For some it will be $200 or $1000. Some with massive bank rolls might have a higher number. The point is to trade an amount you are comfortable losing. This will prevent a greedy trade that will wipe out your account.
Step #5: Timing the Entry
We should look at a stock to determine how to time our entry. I will pick a time frame when the market was bull based on Step #2. The stock is BHP.

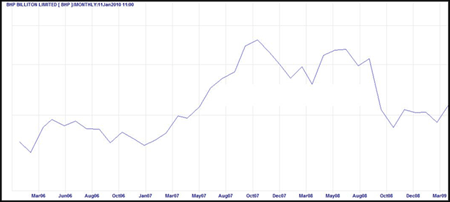
First we look at a very long range chart of the stock that spans over many years. I can see the prices where the stock has bounced at back in March 2006, January 2007, October 2008, and just before March 2009. These bounces give me some confidence that the stock has support underneath it at these levels. The current share price (imagining I am in March to April of 2009) is close to these support levels. Next I zoom in for a closer look.
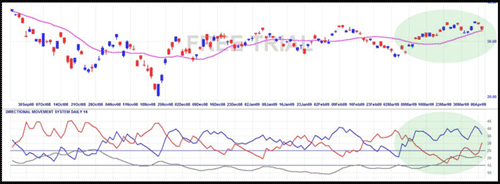
For my closer examination of the stock, I will follow a very simple system. The trend following tool of ADX with +DMI and –DMI will be used with 14 day periods. If that made no sense, do not worry. For this example I will buy when the blue is overtop the red in the bottom indicator box and when the price breaks above its 20 day moving average. If both of those criteria are met, I purchase the CFD.

The upper box shows a daily chart of BHP with candlesticks. This type of chart is good for showing opening prices, closing prices, the day’s range, and direction. The bottom half of the chart shows an ADX indicator box. You should see two wrestling red and blue lines and a gray line that we will ignore. Looking to the far right on the chart we see that the blue has been overtopping red for some time now in the ADX indicator box. This will give me a poor entry price since the trend may be close to exhaustion. I will wait for my next opportunity to purchase my CFD.

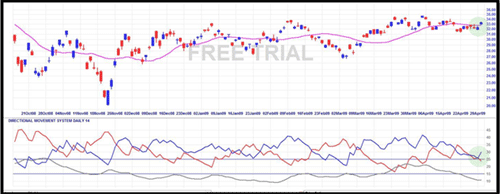
My patience is rewarded as can be seen in the above diagram since one month later the blue or positive DMI crosses above the red or negative DMI which gives me a buy signal. In the upper half where the price movement is, the price jumps above the 20 day moving average to give me an entry signal. My purchase price for the CFD is just above $33.00, perhaps around $33.30 depending on the exact timing of the trade. The purchase day is the very last blue candlestick on the chart.
If I risk $200 on the trade itself (less transaction fees), I will receive 120 CFD’s for $199.80. This figure is based on a 5% margin requirement and we will add a total of $30 on later for entry and exit transaction fees.
Step #6: Having Stop-losses in Place
While we hope this trade will be profitable, we need to be ready for a loss as well. What is an acceptable amount of loss for this trade? We really do not want to lose more than the $200. So if the margin requirement is 5%, then a 5% drop in stock value will wipe out our capital for that trade. If your margin requirement is higher than this, it is still good to stick to the 5% rule for a short-term trade.
Now, depending on your strategy this stop-loss will vary. For a very short term trade, some will choose a stop-loss of a percent or two. Others with a longer range strategy will chose up to a 10% stop-loss.
Your stop-loss will greatly depend on your strategy. For my simple strategy above, 5% will be adequate. If my purchase price is $33.30, the stock can fall to a maximum of $31.63 before we exit the trade.
Step #7: Profit Taking Strategy
Picking the right stock with the correct entry is only part of the battle. A profitable trader needs to know when to sell his CFD at the right time to turn virtual equity into real dollars. How does one pick an exit strategy that will maximize profitability?
There are many ways one can take profits. Here are a few ways.
- Set a limit that you are happy with. Some will sell if the stock rises 5% within the first few days. This way they can double their investment (assuming a 5% margin rate). However, if you use a 5% stop-loss, this will also mean that you need to pick winners over 50% of the time to break even.
- Trailing stop-losses can double up as profit takers. If the stock goes up 10% and falls back down 5%, your stop-loss will profit you out for a total 5% gain multiplied by your leverage. This is assuming a 5% trailing stop-loss.
- PSAR is another similar method to a trailing stop-loss that will tighten up around the price as it rises. The Parabolic Stop and Reverse is an excellent indicator for suggesting exit prices.
- As the prices fall toward the 20 day moving average, you might want to consider selling.
How did the trade turn out?

As we can see, the price went from $33.30 at our entry price, to almost $36.00. Then we see a funny looking red cross which is the very last price bar. This often shows indecision and is called a doji star. Selling at this point is a 7.5% gain, multiplied by 20 times the leverage for a 150% profit taking.
Most people would not have sold at this level though. How did the following days treat the stock?

The price did trade as low as about $32.30. This is still above our $31.63 total stop-loss. But let’s end the chart here and assume a short term exit strategy. For those curious, the stock did go up to $38 shortly thereafter.
How did each of our profit taking strategies fare?
Gross Results
- If we had set a 5% profit limit, we would have held for 3 days and doubled our investment minus transaction fees and overnight financing.
- If we used the trailing stop-loss of 5%, we would have received 2% profits multiplied by 20 times the leverage for 40% gain minus transaction fees and about 8 days of overnight financing.
- Since the stock gapped down, PSAR would have given an exit signal around $33.00 overall for less than a one percent loss. Multiplied by 20 this equates to 20 percent of a loss plus transaction fees and 10 days of overnight financing.
- If we used the 20 day moving average as a sell point, it would work out to exactly the same as scenario 3. Some traders will tighten up this number to a 10 day moving average. Using the 10 day moving average would have netted 3% profits times 20, or 60% gross capital gain.
Net Results
| 5% profit |
$200 |
$30 |
$2.31 |
$167.69 |
84% |
| 5% trailing stop loss |
$80 |
$30 |
$6.16 |
$43.84 |
22% |
| PSAR |
-$40 |
$30 |
$7.70 |
-$77.70 |
-39% |
| 20 day MA |
-$40 |
$30 |
$7.70 |
-$77.70 |
-39% |
| 10 day MA |
$120 |
$30 |
$6.93 |
$83.07 |
69% |
Trading CFD
Clearly, we need to formulate a plan that covers many aspects of our trading. We need to do our homework to time our purchases with the market, pick sound stocks, time our entries and exits, and have a solid risk management plan. Each plan will vary depending on the desired level of risk and reward, and the specific trading strategy. Some will use momentum, others trend, and still others a swing style trading.
Whatever system you use, always perform due diligence with each step to ensure a lengthy and prosperous trading career.