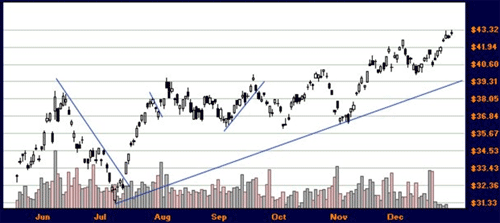
There is a gamut of trends that can be picked out from the following chart. Some may last for a few days while others might continue over a range of a year or greater.
BHP with a variety of trendlines

Before jumping aboard a trend, it is vital to know how strong the trend is, and at what stage the trend is in. Trends are most profitably traded when they are fairly new since they lose strength over time or at least become susceptible to consolidation. Developed J. Welles Wilder, the ADX, or the Average Directional Index, is able to help in this regard.
ADX and Strength of Trend
Many new traders erroneously feel that the stronger the trend you invest into, the lower the risk. Actually, quite the opposite is true. Riding a trend is much like surfing; you need to stay ahead of the cresting wave. Similarly, we try to ride new swells on the ADX indicator.
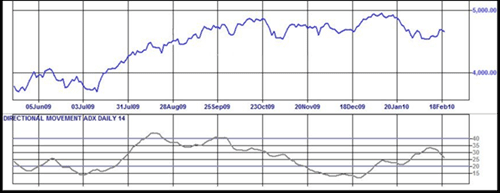
The ADX is an oscillator type indicator with relative levels between 0 and 100. Depending on the ADX value, we can also determine the strength of the trend. The ADX indicator box shows trend strength for nine months on BHP.
BHP trend with ADX

The higher the line is, the stronger the trend. BHP has not trended very strongly over the past nine months as the highest reading is only around 26. This is how we can read the ADX line.
ADX Value Type of Trend
- 0-20 Without trend or very weak
- 20-40 Moderate trend
- 40-70 Strong trend
- 70-100 Extremely strong trend
The goal is to capture the trend as it moves from no trend to a moderate trend. As well, a new trend coming off a consolidation pattern can be especially profitable. So we obey the following two rules when trying to trade the trend with the ADX.
- Wait for the ADX to remain below the 20 for a month or more
- Trade with the trend as the ADX goes past the 20
One interesting note: the ADX line does not differentiate between uptrend and downtrend. That is to say, as the ADX crosses the 20 mark, you will need to look at the stock chart to determine if the new trend is an uptrend or a downtrend.
ADX Values and Settings to Remember
Before we examine a couple of charts with ADX indicator boxes, we need to cover a couple of settings.
- 14 periods is a good default setting - If you are using daily charts, the ADX will use the last 14 days to determine the trend. Use too small a setting and you will be getting in and out of minor trends that will drain your account. Use too large a setting and you will be climbing aboard a trend too late.
- Use trading signals of 20 and 40 on your ADX indicator box - Some charting programs allow you to customize where your reference lines for generating trading signals exist. Placing one at the 20 is good for entry signals. Placing another at the 40 is good to know when the stock is trending strongly.
Using ADX to Trade the Trend
Some traders will use the ADX to enter early on a trend, and to exit when the trend is weakening. They may enter when the ADX rises above 20, and sell when it falls below 40. I have found the ADX to be quite useful for longer range entry signals, but leave the specific exit signals to other tools. We will use the ADX as an exit suggestion only rather than an exact exit signal generator.
We will use the rule of trading with the trend as the ADX rises above the 20 and putting up a red flag as the ADX line turns down thus signaling a weakening trend.
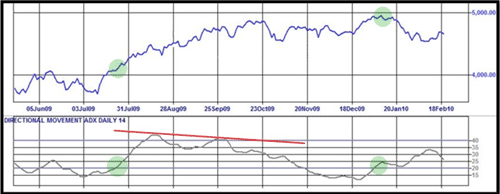
ASX 200 with ADX and 9 month trend

Thus we have the following clues with the ADX:
- Trend signal in late July when ADX rises above 20 after consolidating over one month. The ASX 200 trades up sharply.
- From August to October the trend weakens as represented by the falling ADX line. This is a reminder only as we use other tools to exit.

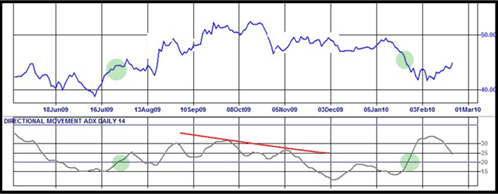
We can see the entry signals and the weakening trend warning by looking at the stock WPL
WPL with ADX indicator box

Again, look carefully at where the stock’s ADX line stays below the 20 mark, and then rises above. This is the start of a new trend. As the ADX line drops off, the trend in weakening. This early warning signal should encourage us to re-examine our exit strategy.
ADX and Other Tools
The ADX is often plotted in a box along with red and green lines. These multi-colored lines are Directional Movement Index lines. How to use these in conjunction with trend will be outlined next.
ADX Formula
ADXi = [(ADX(i-1) * (n - 1)) + DXi] / n
where n = Smoothing Period
DX = [ 100 * ABS( (+DI) - (-DI) ) ] / ( (+DI) + (-DI) )