A chart pattern is simply a recognisable trading formation with a predictable outcome. Perhaps a stock will bounce twice off a certain price level before rocketing up. This will no doubt resemble a W making it a recognizable chart pattern. Or the price might take three attempts to reach new highs with the middle run being the highest. This could look like two shoulders with a head in the middle. This will often turn the trend from bull to bear.
Chart patterns are usually categorised into two major groups: continuation and reversal patterns.
Continuation Patterns
The price of a stock will trade in a certain direction before taking a breather. The stock has the opportunity to either resume its trend or reverse direction. If the stock merely consolidates and resumes its trend, we call this a continuation pattern. The pattern formation will give us a clue as to the stocks next move: continuation or reversal of trend.
Some common continuation patterns are: Flag and Pennant, Ascending and Descending Triangles, Price Channels, and Cup with Handle. We will discuss a couple patterns from both the continuation and reversal categories that we feel have high success rates.
Ascending and Descending Triangles
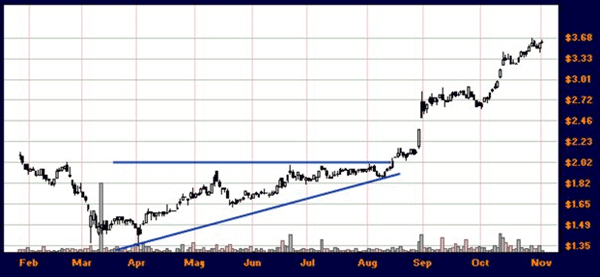
The concept behind the ascending triangle is easy to follow. The stock is in a trend. As the stock rises it will hit resistance (the upper blue line). Over a few weeks to some months the trading range will continue to tighten as resistance is being hit (the bottom blue line). The stock will come to a point following which the stock will often pop upwards. This looks like an ascending triangle when drawn.
CPU with Ascending Triangle
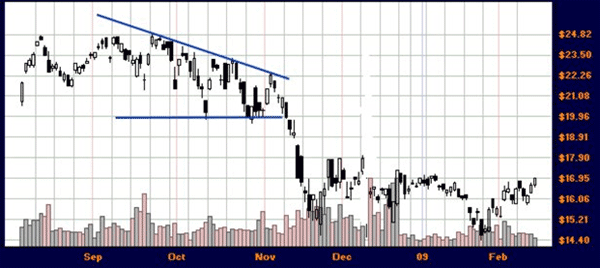
A descending triangle is just the opposite. A stock that is trending down hits support. The price may have a wide trading range over time but this begins to tighten each time the stock falls and hits the support. After a few weeks or many months the trading range tightens to almost a point, following which the stock will often break through support resuming its downtrend.
WBC with Descending Triangle
Cup with Handle Continuation Pattern
There is a wealth of information available about the cup and handle. Perhaps some of the most in-depth analysis is by William J. O’Neil who invented the CAN SLIM method of investing in high growth stocks with this pattern.
A basic set of rules should be followed when looking for a cup and handle pattern with the expectation that the stock will shoot upwards.
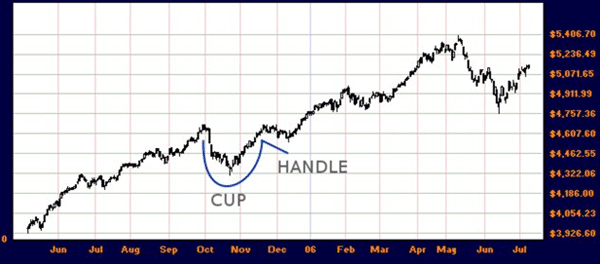
Look for a well rounded out U bottom instead of a severe V to the cup formation. A healthy consolidation pattern such as this will take time.
The handle portion needs to go down in price. It is not valid to have the handle prices drifting higher.
Prices in the handle should go down roughly 1/3 of the cup.
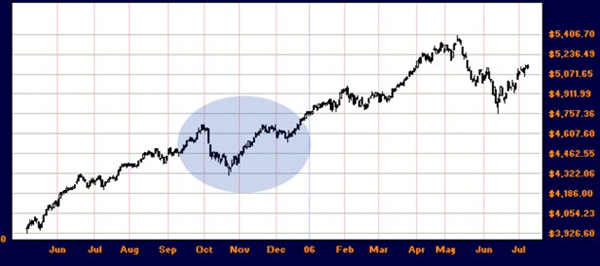
Using the ASX 200 index, we will briefly analyse a cup and handle pattern. The blue highlighted area contains the cup and handle.
ASX 200 with Cup and Handle
Where do you decide to buy-in with this pattern? There are two methods depending on your penchant for risk:
- Treat the handle like a mini trendline. When the price breaks upward on your trendline, buy.
- The highest point in the handle is your buy point. In late November the index traded as high as 4,680 before jutting down. The index now needs to break above that level to have a buy signal
One final note, when the price breaks out past the handle, the volume should be roughly double or more the daily average. If volume does not spike, the breakout is invalid.
Reversal Patterns
Some common patterns exist that will point to a reversal of trend. The two patterns we will discuss are:
- Double bottom
- Head and shoulders
Double Bottom Reversal Pattern
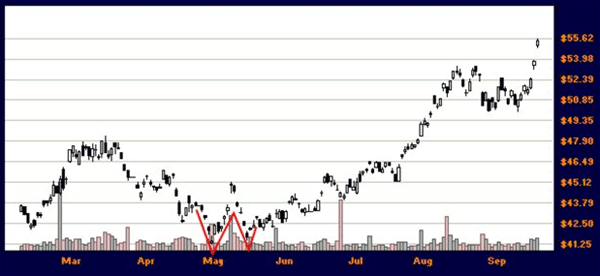
The double bottom pattern looks much like the letter W. The idea behind the formation is that the share price hits support twice before strongly trending upwards. If support holds strong at almost identical levels, this gives much confidence to the investor.
RIO with Double Bottom Reversal
Below are a few commonly held rules when trading such a pattern:
- Volume should increase on the uphill side of the W to confirm the validity of the pattern
- The advance of the first bounce should be 10 – 20 percent of the share price
- The second bounce should form within 3 – 4 percent of the first low
Within 10 months of the double bottom pattern, RIO.AX went on to almost double in share value.
Head and Shoulders Reversal Pattern
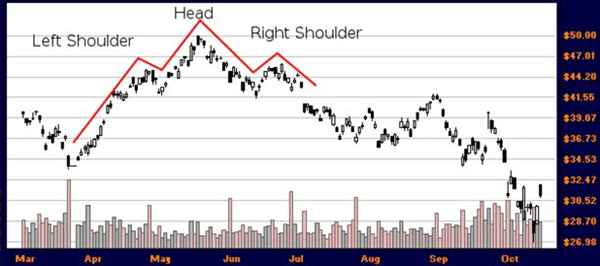
The head and shoulders pattern is a widely accepted reversal pattern that has been used with much reliability. The stock is in an uptrend when it makes three attempts to go higher. On the third rally the uptrend breaks down and a new downtrend ensues.
This is what a head and shoulders pattern looks like:
BHP Head and Shoulders Pattern
Here are a few technical analysis pointers when trying to identify this pattern:
- The head should be taller than the left and right shoulder.
- Some chartists prefer if the right shoulder is higher than the left, but this need not always be the case.
- You go short on this pattern as the right shoulder breaks down past the neckline. Then neckline is the support level where the shoulders bounce off. In this pattern it is at $41.55.
- The price target is the difference between the neckline (shown below), and the tip of the head. This example has the price target at $8.50 of profit, or riding the stock from $40 to $31.50.
- Volume should increase greatly as the neckline is broken.
BHP with Neckline
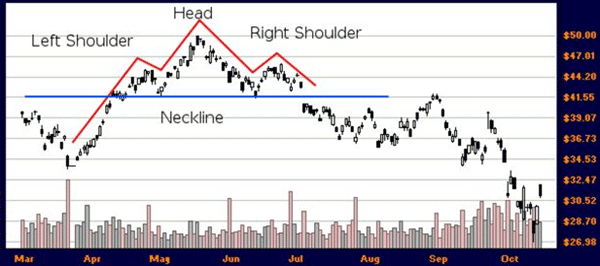
Chart Patterns and Sound Trading
It is important to keep in mind that trading the market changes over time. What worked well in the 1980’s may not work so well now. If you decide to dig further into chart patterns, be sure to have up to date information and paper trade the potential set-ups first until you feel confident.
As well, there are a variety of chart patterns that may or may not have a highly predictable outcome. Generally speaking, chart patterns are merely one tool to be used with many other technical analysis tools for sound trading.
Lastly, weak chart patterns on thinly traded or illiquid stocks should be avoided. Traders with a large bankroll may be able to manipulate the chart to trap investors.