One of the advantages of using bar charts or candlestick charts is the ability to see when prices jump higher or lower while missing an entire trading range. A line chart will merely show a continuous trading line that is misleading.
NCM during 2009 – line chart
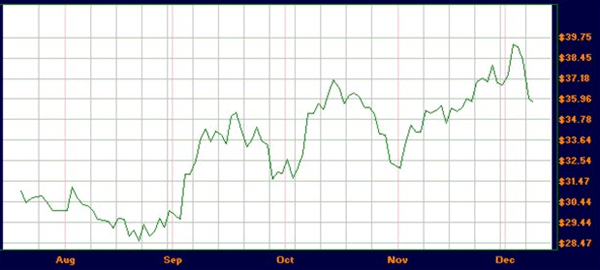
Were we to examine this identical chart with candlesticks we would notice an interesting pattern.
NCM during 2009 – candlestick chart
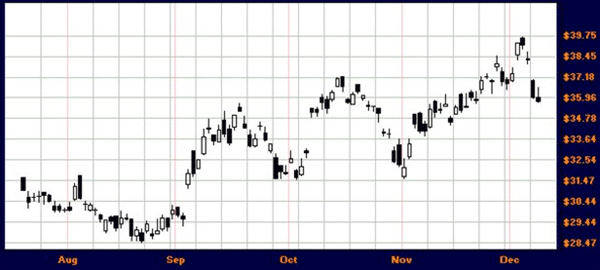
Within this chart is a couple of noticeable spots where the price jumped or fell while gapping across certain price ranges.
- September 2nd prices closed at $29.58. The next morning they gapped up to $31.30 missing most of the $29 - $31 range.
- October 6th the prices closed at $32.93. The next morning the price jumped to $35.37.
- December 4th NCM closed at $38.30. The next trading day it opened at $37.00 and continued to fall without once trading in the $37 range.
Gap-ups and Gap-downs
When prices jump right up through a trading range this is called a gap-up. This will often occur when positive news is released while the market is closed, or when a major event occurs such as earnings reports and has an unexpected upside surprise.
Gap-downs occur when prices jump downward and skip a price range. As well, negative news after the market closes or negative EPS surprises can be the cause of such an effect.
The Major Types of Gaps
Gaps are usually categorized in four major classes: common, exhaustion, breakaway, and runaway.
It is important to know which type of gap fits the data since the trading may continue in the direction of the large move, it may reverse direction, or the price may retreat and then resume its normal direction.
The Common Gap
Also termed area gaps or trading gaps, these leaps in price movement are common and uneventful. The market psychology will change somewhat between market closing and opening the next trading day. When the market opens significantly different the next morning with little apparent reason, and it does not fit the mentality of the other gap types, it will likely be a common gap.
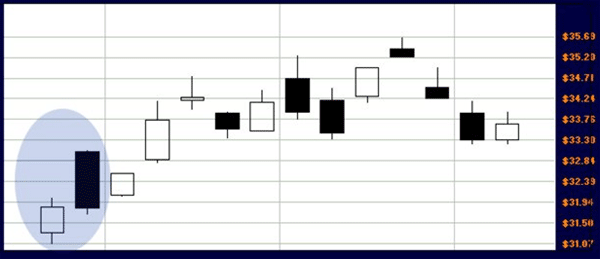
Common gaps are usually filled in quite quickly. Filling in means the price reverses the direction of the gap, if only temporarily, and then resumes trading. Often, the gaps are filled the same day.
September 3rd, NCM closed at $31.85. The morning of September 4th had the price opening at $33.04. The price jumped almost four percent overnight. But the price slid during the day and closed three cents lower than the September 3rd.
NCM Common Gap-up
The Exhaustion Gap
After prices have been either trending up or down for a while, the sentiment may be nearing exhaustion.
Imagine a stock trading downwards for a long period of time despite company restructuring and improvement of the bottom line. After a long while, the last of the weak hands finally give up and sell off the remainder of their stock in despair. It is quickly bought up by bargain hunters or technical analysts, the price may find solid ground and can reverse the trend.
Conversely, perhaps the stock has been climbing for some time in an upwards trend. As euphoria reaches an all time high, the price gaps up. The last of the buyers come out of the woodwork thinking this is a sure bet as the current stock holders dump their shares in great quantity. After this initial transfer and no new buyers, the price reverses direction.
Look for these two requirements when trying to decide if the gap is an exhaustion gap.
- Extremely high volume (perhaps 2x the normal)
- After a long-time trend has been in place
Examining NCM at an earlier date, we will examine the blue area that shows a reversal from a downtrend to an uptrend.
NCM Exhaustion Gap
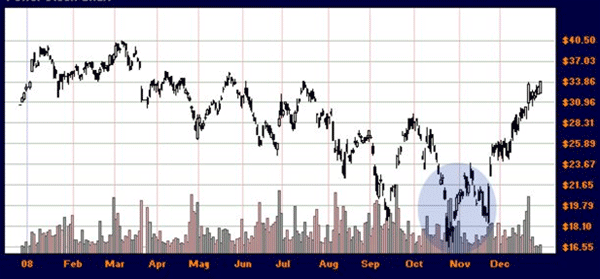
Next we will zoom in to look at the price gap and volume a little more closely.
NCM Exhaustion Gap
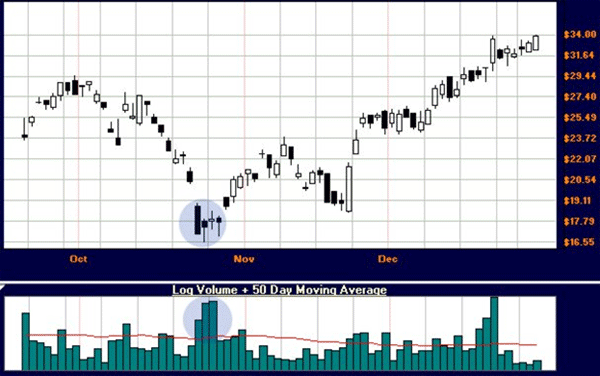
Note the two blue circles. One shows the gap on the char, the other shows the volume spike during those trades. Because this occurs at the end of a very long down-trend, we can assume the price will fill and reverse…which it does.
Breakaway Gaps
This type of gap is considered a breakout. Prices will usually go through stages of trending, then consolidation, and back to trending again. Sometimes, after a consolidation pattern, or after toying with a support and resistance, prices will breakaway.
- Prices break upwards or downward through support or resistance
- Volume increases
- The trend usually continues
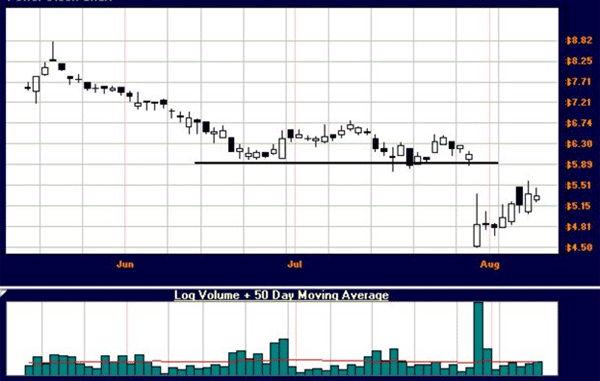
Notice on the stock ALL how the price consolidates. When the price finally jumps down to break resistance, the volume also increases.
ALL Breakaway Gap
Runaway or Continuation Gaps
The final class of gap is one that occurs in the middle of a trend.
Perhaps the stock is moving up at a measured pace. Suddenly there is an increase of interest in the stock and the price gaps up and continues to trade in the former trend.
Or the stock may be declining over time and there is an increased bearish sentiment in the stock and the price gaps downward and continues to trade lower.
CPU Continuation Gap
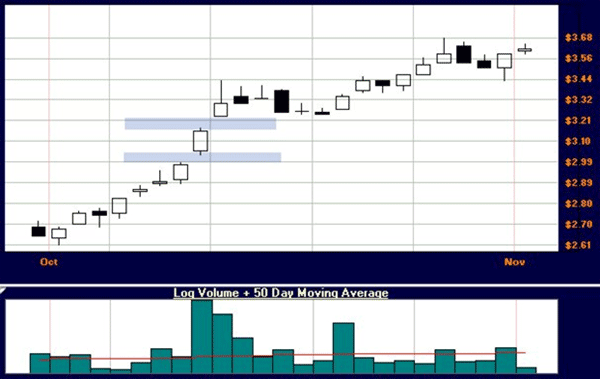
As can be seen in CPU.AX, the trend is in the middle of its movement when a couple of minor gaps occur with decent volume as the trend continues.
Should You Play the Gap?
There are numerous ways to play gaps. Some will day-trade them, others will use them as signals needing confirmation for a reversal, fade the gap, and so on. Still others will shy away from them altogether since such a drastic change in price can have large repercussions if the investor plays the gap wrong.
If you are interested in profiting from gaps, you will first need to get very proficient at telling one from another. Make sure you examine support and resistance levels, if the gap is at the middle of a trend or at the late stages of it, and if volume is a supporting factor.