Technical Analysis Indicators: Leading versus Lagging Indicators
Technical analysis indicators come in two basic varieties: leading and lagging. The indicator itself is a derivative of share price and (or) volume. This does not change between the two categories. The difference between the two (leading and lagging) is how the data is used to generate buy and sell signals.
Leading and Lagging Indicator Signals
To see the difference, think of buying and selling homes. If the housing price drops 10 percent, one individual may suggest that the drop is too big, too quick, and prices will bounce back up… at least temporarily. He will buy a home with the hope of asset appreciation.
Another individual will view the pricing drop as part of a bigger overall trend. He will sell his home to cut his losses from an expected larger price drop.
The first person could be described as using a leading indicator. They are guessing future prices of homes, based on an expected change in investor mentality. The second person is using a lagging indicator that is merely following an established trend.
Who is right and who is wrong? Just one or both may be right – much depends on the market. The market might hiccup up and then resume trading downwards. Or the market might spring back healthy. There are different types of market and this is important for the technical analyst: trending or trading markets. A trending market works well with lagging indicators, while a trading market that is up and down like lapping waves is more profitable with leading indicators.
Comparing the Signals with a Stock Chart
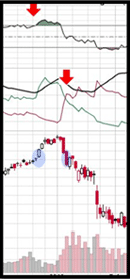
 The chart to the right highlights the differences in signals given with leading and lagging indicators. We will use a very simple exit strategy with the top two indicators (RSI and ADX with DMI).
The top RSI indicator box can be used to generate a sell signal at the red arrow when the price appears to be overbought. If you look at the price chart, you can see a blue circle. The selling with this leading indicator is a bit premature.
The second indicator box gives a sell signal when the red line crosses above the green. As you can see with the second blue circle, the lagging indicators exit strategy is a bit late.
Each indicator has its strength or weakness and can be used well at different times in the market: momentum or trend trading. This is an important point to remember as the different indicators are discussed and analysed.