Moving averages are often used to determine and track trends. Each moving average has its own significance. For instance, the 350, 200, 50, and 10 day moving averages are interpreted and traded differently. The variety of moving averages and how to read them will be discussed in a later article.
What is the MACD?
The Moving Average Convergence Divergence (MACD for short), is a combination of moving averages designed to signal a change in trend. Because it is based on moving averages, this is considered a lagging indicator, although it does have elements of leading ones also.
What Makes Up the MACD?
The formula is quite simple based on exponential moving averages (this simply means the moving average is weighted toward recent price moves instead of treating all data equal).
MACD Formula = EMA[12] – EMA[26]
What does this formula mean? It signifies that when the short term trend differs from the long-term trend, the MACD will change. If the 26 moving day average of a stock is negative, but the 12 day moving average is positive, the MACD will plot this as an upwards line. If the 26 day moving average is extremely bullish, but the 12 day moving average is only mildly bullish, this will be plotted as a downward MACD line.
The idea is that the shorter term trend (12 days or periods) is signaling a change when compared to a longer trend.
The MACD and Charts
This lesson may appear like a wild mess of moving averages and lines so we will try to progressively explain each step. To demonstrate the MACD we are going to examine the ASX 200.
- The thick blue line is the price of the ASX 200
- The thin red line is the exponential moving average with a 12 days setting
- The thin green line is the exponential moving average with a 26 days setting
ASX 200 with 3 month chart
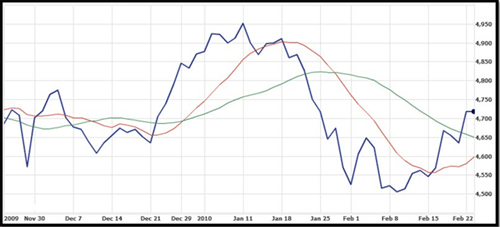
You must pay attention to the relationship of the red (12 EMA) and the green (26 EMA) line. Notice in mid-December to mid-January where the shorter term moving average is pulling away from the longer term moving average. Then from the middle of January to mid-February the shorter term trend (red line) drops in comparison to the longer term trend.
We would naturally expect the MACD line to rise and fall in accord to the convergence and divergence of these two moving averages.
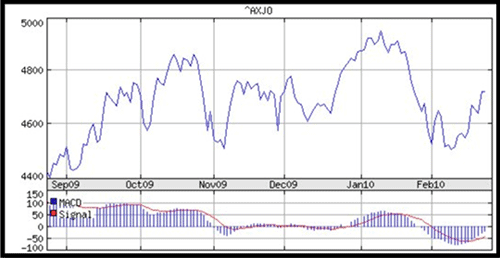
ASX 200 with 3 month MACD
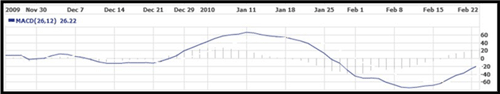
The MACD indicator agrees fully with our expectations. But there is one more moving average line we need to consider before we discuss how to interpret the MACD. This is the 9 day moving average signal line.
MACD and the 9 Day Trigger
The MACD line tries to signal when a trend change may be present by drawing changes between the long-term trend and the short term trend. The idea is to follow the short-term trend as a discrepancy occurs. But when should the trader jump onto the new trend? Enter the 9 day moving average setting as a signal.
ASX 200 with 3 month MACD and signal
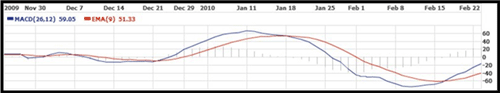
This indicator is identical to the one in the previous section with the exception of a new 9 day exponential moving average colored red. Now we have the sum of three moving averages on this chart, although we only see two lines since the blue MACD line really represents two.
Now it is time to learn the common ways to trade the MACD.
How to Trade with the MACD
Although there may be more, three common approaches are used when trading the MACD.
- When MACD and Price Chart disagree
- When MACD (blue) crosses the signal line (red)
- When MACD crosses above 0
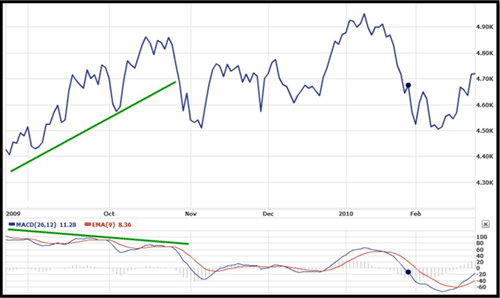
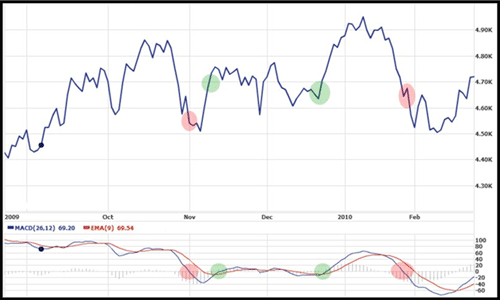
1. When MACD and Price Chart Disagree
When the MACD and the price chart disagree, this can be called divergence. This can occur in a couple of different ways. Remember that the MACD is merely showing acceleration or deceleration, or the difference between short term trend and long term trend.
If the MACD is moving down, the short term trend is decelerating. Yet, the prices might be still moving upwards, albeit a slower pace. This might indicate a reversal is near. The chart below shows how the ASX 200 index continued to climb while the MACD was turning down. This divergence should be interpreted as a potential breakdown of current trend. The upwards trend did in fact fall apart and trade sideways.
ASX 200 divergence with MACD
On the other hand, if you notice the MACD is going up despite prices still dropping, this could signal a potential trend change from bear to bull.
2. When MACD (blue) crosses the signal line (red)
When the MACD crosses the 9 day signal line, this is also interpreted as a trading signal. As the MACD goes up past the signal, this is bullish. When the MACD falls below the signal line, this is bearish.
ASX 200 with bullish and bearish crossovers
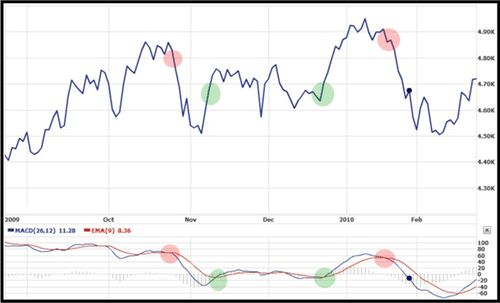
This is quite simple to see and trade. If a trader is only using crossovers to trade, he can also use the MACD histogram which is another derivative. You can likely see some faint bars in the background of the MACD indicator box. This is the MACD histogram.
When the bars go from pointing down to pointing up (or when the 0 reference is crossed) this is identical to a bullish crossover. When the bars turn from pointing up to pointing down (or when the 0 reference is pierced), this is the same as the bearish crossover.
ASX 200 with Histogram
3. When MACD crosses above 0
When the MACD line turns above the 0 reference, this is considered bullish. When the MACD line falls below the 0 reference, this is considered bearish. Many regard this as to be a weak signal, and I would agree. While it may recommend a trade, it should be used in conjunction with other signals.
ASX 200 with MACD crossing the 0
Summary of Trading the MACD
Although the MACD is a very popular tool, it is just one trend following device. It can generate many signals for traders to follow. The strongest is divergence from price, then crossovers with the signal line, and lastly crossing over the 0 reference line.
Most traders will use the MACD, although they will either get confirmation with another indicator or only use it as a secondary trading signal.