Technical Analysis - Momentum Indicators: ROC, Stochastic & RSI
Another class of indicators falls into the momentum category. Momentum generally refers to the rate of change. This can be thought of as an increase or decrease in pressure.
For instance, a stock may be rising at one dollar per month. The momentum is non-existent even though this stock is going up because there is no change in the rate at which it rises. If the stock is rising one dollar this month and none the next, the momentum would be dropping. As well, if the stock increased from one dollar price appreciation to two dollars of appreciation the next month, momentum would be rising.
So when referring to momentum, we can usually refer to it as a rate of change.
What Does Momentum Tell Us?
While there are many ways to trade momentum indicators, momentum is a good gauge of how emotions are swinging in the market place. If a sudden euphoria hits, the momentum indicator will reflect this. If panic takes over, the momentum will also show us how the mood has soured. They are commonly considered to be leading indicators.
Generally speaking, momentum trading is a shorter window than trend trading and requires practice to properly analyze trading signals. Often, a new trader will be drawn in by the apparent simplicity of such tools, only to learn later that trading emotions is a little harder than it first looks.
Common Momentum Style Indicators
A few of the best or more popular momentum indicators are:
- Momentum
- Rate of Change (ROC)
- Stochastic Oscillator
- Relative Strength Index (RSI)
- Commodity Channel Index (CCI is a momentum trend hybrid as is the MACD)
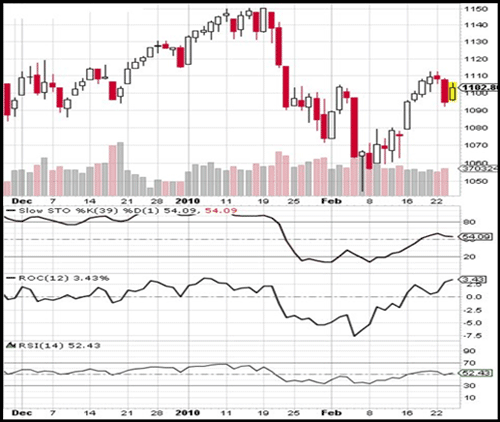
Here is an example of what a few typical momentum indicators may look like.
Chart with 3 different momentum indicators

In succeeding articles, we will go in depth with a few different momentum indicators.