The Money Flow Index is an interesting volume following indicator because it combines volume and momentum to generate signals. As such, it is less concerned with the overall figures, but displays the force or pressure the volume has in an oscillator format.
All with MFI in bottom indicator box
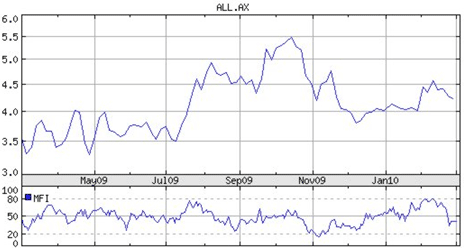
Summary of How Money Flow Index is Calculated
Without getting into a litany of boring details, we will give an overview of what makes the Money Flow Index tick. Let us assume we are looking at 14 days worth of data to calculate our MFI.
First we need a typical price for each day. Instead of just using an opening price or a closing price, we will use an average of the high, low, and the close. Next we need to factor in volume. We multiply this typical price by the volume on that day. Third, we compare today with yesterday. If our typical price is higher, our volume is positive. If our typical price is negative, our volume is considered negative. We look at the last 14 days and have our positive volume minus our negative to calculate our MFI value which is represented in a 0 – 100 scale.
Are you still awake? That is enough about the calculations and onto practical application.
Trading Signals of the MFI
As mentioned earlier, this is a good alternative to using the On Balanced Volume if your charting software does not allow a moving average on the OBV.
There are three key signals we are going to use with the Money Flow Index: divergences, overbought / oversold signals, and crossing of the 50. By now we should be getting comfortable with these signals as they are quite common to many indicators we examine.
1. MFI Divergences
When the Money Flow Index is rising, a momentous accumulation of stock is occurring. However, the actual price of the stock might be somewhat depressed. This type of divergence is signaling that a turnaround might be just ahead and the stock might pop upwards.
As well, if the MFI is falling but the stock prices are making new highs, the volume pressure has slackened allowing the share price to fall. You may want to consider getting out of the stock when the prices break down.
Aristocrat Leisure Limited (ALL) with MFI divergence
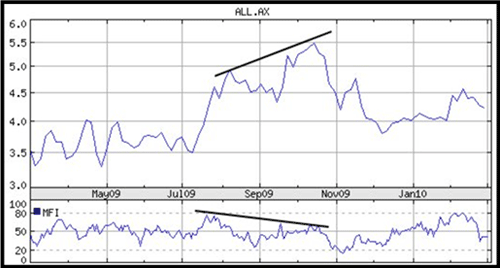
With the chart above detailing ALL, note how the stock continued to bounce higher while the MFI bounced lower. Without strong volume sustaining the price of ALL, the bottom fell out. People who carefully followed the MFI should’ve already liquidated by the time the drop occurred.
2. Money Flow Index with Overbought/Oversold Signals
Remember that most rookie traders will use any momentum signal to generate overbought and oversold signals. This occurs when the MFI either goes above the 80 which creates a relatively overbought market, or when the MFI falls below the 20 which creates an oversold market. These are relative signals only. In a trending market the prices will often continue in the initial direction.
Below is an example of how the overbought and oversold signals are made, but also the misdirection they can give.
Intoll Group Stapled (ITO) with overbought and oversold signals
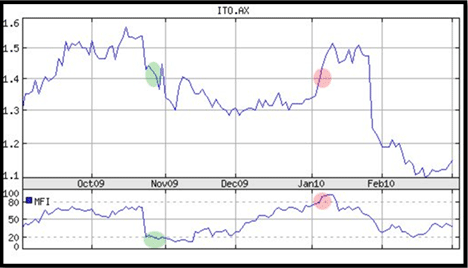
The oversold buy signal occurs around the 1.40 to 1.42 range. The stock keeps falling to 1.30. It consolidates for a couple of months and gives a sell signal based on being oversold around 1.40. So this method took two and a half months and was a flat trade.
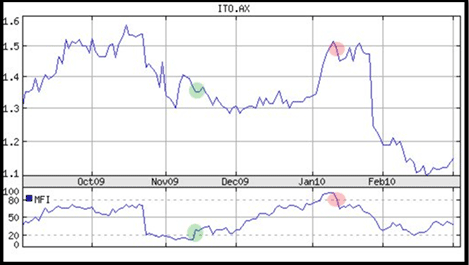
A better way is to wait, not just for the MFI to go below the 20, but to wait for it to rise back above it. Do not sell when the MFI simply goes above the 80 but when it falls back down through the 80. This would have resulted in a more profitable trade of buying at 1.37 and selling and 1.48. Instead of grabbing falling knife this method waits for the MFI to reverse slightly first.
ITO with modified overbought and oversold signals
3. MFI crossing the 50
This final method is quite simplistic but will also generate signals in pairs. If the MFI rises above the 50 you buy, when it falls below the 50 you sell. The other method of overbought and oversold as detailed above may give a buy signal but never created a sell signal. That makes this method safer, and still remains quite profitable.
The only caveat is that a whipsaw effect can occur if the stock is sitting idly with neither positive nor negative momentum.
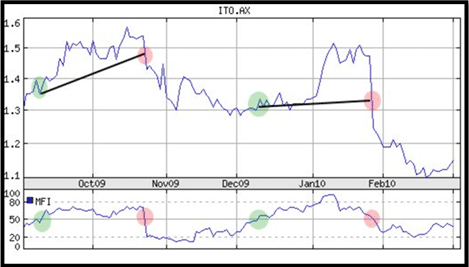
The chart above shows 2 trade pairs. The first is profitable and did not even show up when using 20/80 as our overbought/oversold signals. The second is a flat trade. All in all, this is a decent method to use in conjunction with other indicators for the investor that wants clear and unambiguous signals.