Developed by technical analyst Welles Wilder who also made the RSI and ADX indicators, the Parabolic Stop and Reversal system has proved a worthy indicator for expert traders. What makes the PSAR so valuable is the simplicity with which to elicit profitable trading signals from.
The Parabolic Stop and Reversal Indicator Goal
Before we go any further, we need to discuss settings. Use the default settings of (0.02, 0.2). These variables can be altered to allow for longer term trading, but for the sake of this article we will use stock settings.
The goal of the PSAR is to determine a trend, and then establish buy and sell signals on that trend. Both up trends and down trends are given equal opportunity with the PSAR indicator.
The PSAR Trading Signals
Following the trading signals is incredibly easy.
- When dots appear underneath the share price, your signal is to buy. When the share price hits or is equal to the dots on the underside, you sell.
- When the dots first appear above the stock, you short. When the share price rises to touch the dots you cover.
With just a glance you can determine the current buy or sell recommendation based on whether dots are above (sell) or below (buy) the stock.
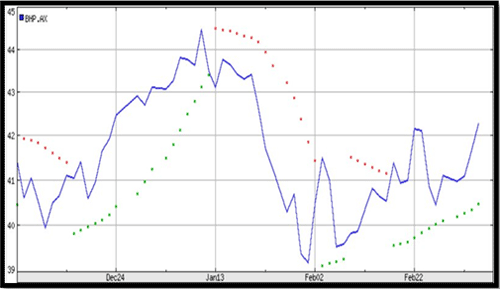
BHP Billiton (BHP) with PSAR

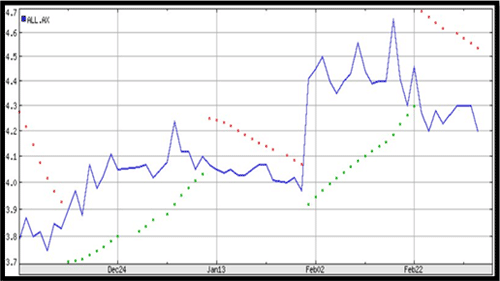
The chart above even makes your trading signals more clear with green and red dots. Green is a bullish signal and red is a bearish signal. Simply buy on green and sell on red.
Aristocrat Leaisure (ALL) with PSAR

Cautions and Benefits with the PSAR
At first glance it may appear that this is the world’s easiest trading system to buy and sell based on dots. But this would be misleading indeed. The PSAR is very susceptible to whipsaws in the market. If a stock is trading sideways (up and down rapidly), the PSAR will generate a large volume of losing signals. The PSAR tool for buying and selling works well in trending markets only.
But how do you know if you are in a trending market or not? Reading the other sections on trendlines, moving averages, and trend following tools will help. Once you have established a trending market with the aid of these other indicators, the PSAR can be used profitably.
One of the benefits to the PSAR is the mechanical nature of the signals given with little to no interpretation necessary. Some technical analysis tools require a degree in interpretation and this leads to great subjectivity. The PSAR is unambiguous and clear in the signals given.
Parabolic Stop and Reversal
- Good for trending markets
- Creates and objective trading environment
- Clear signals
- Great for exits
Exit Strategies and the PSAR
Many traders have found that the PSAR is best used for exit signals only. Many other tools are available to provide precise and accurate entry signals. But finding the right exit strategy can be difficult. What makes the PSAR so valuable with exits?
PSAR has a unique feature. Although it may appear like a trailing stop-loss there is one big difference. Trends usually start strong and weaken over time. Finally they reverse direction and trend the opposite way for a period of time.
Trailing stop-losses are static in the sense that the value you enter is the value they stay at. If you have a trailing stop-loss 5 percent below the share price, it will remain at 5 percent. The PSAR is more like a noose that tightens over time. As the trend continues, the PSAR dots get closer and closer to the share price. The PSAR is dynamic because Welles Wilder knew that trends weaken over time.
Follow these simple rules for exit strategies:
- When trading long, exit when share price meets dots on underside
- When trading short, exit when share price meets dots on upper side.
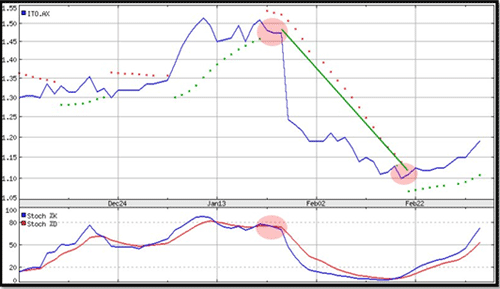
Intoll Group Stapled (ITO) and PSAR exit signals

Let us dissect the above chart. We use Stochastics to generate an entry signal based on a crossover and the bounces off the 80 value (see section on Stochastics). We are now short on the stock ITO. From here we exit exclusively from the PSAR dots on the upper side of the stock (the red ones). I also drew a green line to highlight the trade pair. The trade was entered at 1.45 with a short sale, and exited at 1.13 with a covering of short position.
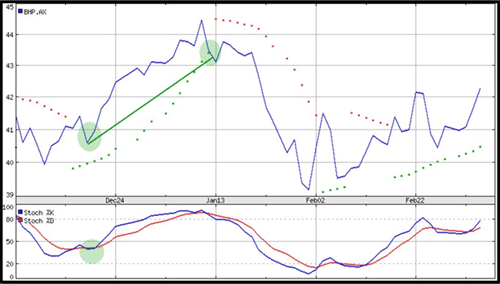
Let us examine a long trade. Again, the stock is BHP.AX. We enter based on a bullish crossover with our Stochastics. We exit when prices hit the PSAR dots on the underside.
BHP and bullish PSAR exit signals

Final Word on PSAR
The Parabolic Stop and Reversal tool is powerful for its simplicity of use. It depends on changing trends and the idea that trends weaken over time. While some traders will be tempted to use this indicator exclusively for all trading signals, most will prefer to use this in conjunction with other momentum, trend, and volume tools.
The PSAR will also create powerful exit signals similar to trailing stop-losses but with a tightening effect.