The Percentage Volume Oscillator (PVO) is an interesting tool that you should already be familiar with even if you have never heard of it before. The reason is that the PVO is the volume counterpart to the MACD. While the MACD is used as a blend of leading and lagging signals to determine price movements, the PVO uses the same equations to make a volume signal.
The only other difference is that the PVO is expressed in percentages while the MACD is in more absolute terms.
The Percentage Volume Oscillator Calculations
Just like the MACD, the Percentage Volume Oscillator starts with the 12 day moving average and subtracts the 26 day moving average. The idea is that the shorter moving average will lead the way. If it significantly differs from the longer term average, you may want to consider getting aboard the gravy train before it leaves the station.
The Percentage Volume Oscillator (PVO) Formula = ((Shorter EMA of Volume - Longer EMA of Volume) / Longer EMA of Volume) x 100
If you are extremely interested in how this works, you are welcome to jump back to the trend following tools where the MACD is dissected in great detail.
Signals Generated with the PVO
Three main signals are generated with the PVO.
- Compare volume to trend
- Crossovers with a 9 day signal line
- Crossing above and below the 0
1. Comparing Volume to the Trend
Using the PVO does take a bit of finesse since it is independent of price. When the PVO rises, this does not mean that the price is rising. It merely means the volume has shot up. We need to look to the chart to see which direction it is heading in. We have seen this before with the ADX that tells of strength of trend, just not the direction of it.
When a stock makes a large move in one direction, the PVO should also shoot up. If it does not we have divergence of volume from price movement. In general, when a new price movement takes place, the volume should shoot up.
Remember this one important piece of advice: volume usually spikes when a stock is coming off consolidation and making another leg of the trend, or when reversing the trend.
When the PVO shoots up ask yourself, "is this is another leg of the same trend, or if the price is about to reverse?". It may be a good time to reread the charting section on trends that give clues when a trend might be breaking down.
Google (GOOG) chart with PVO
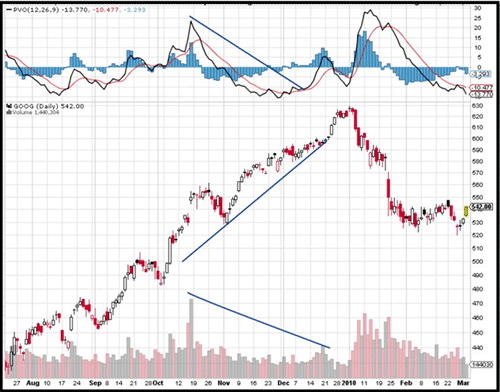
In the chart above I have drawn three blue lines. In the top PVO indicator box, note how the volume is dropping off. This shows that interest in the stock, either buying or selling is starting to wane. But the price chart shows that the prices are continuing to climb. With the bottom blue line I am merely depicting what the PVO already told us, that daily volume is dropping off.
This dropping PVO value is a warning that the stock is in trouble due to falling interest.
Next, look how the PVO rockets up when the price drops in the beginning of 2010. Any strong price move should have an upwards move in PVO, so our downward trend is valid and we sell. I have drawn this with two blue lines.
Google chart with PVO
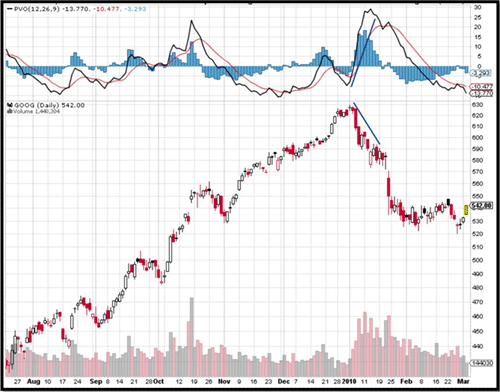
2. Crossovers with a 9 day signal line
Another simple way to trade the PVO is to jump aboard the most recent price movement when the PVO breaks above its 9 day moving average. You can see where the black line rises above the thin red line or where the bars in the background (the histogram) rise above the 0.
While deceivingly simplistic, this will highlight surges in volume that confirm the trend. Jumping aboard when volume is high is a good method to lower overall risk.
Google chart with PVO crossover signals
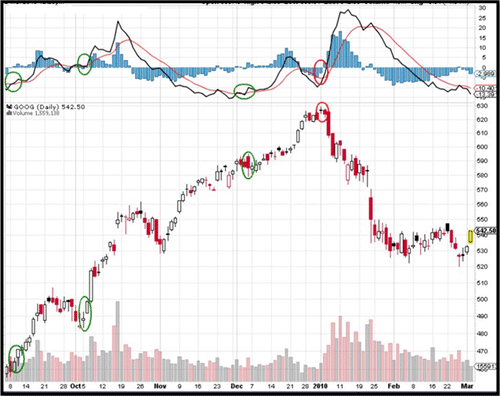
The PVO doesn’t really generate good exit signals. But you can see the entry signals in the chart above: three buy signals and one shorting signal. When the volume spikes you jump aboard that move. Now, it’s debatable which trend December 2009 and January 2010 is telling you to jump aboard: up or down. But by having a good understanding of trend and market cycles (such as different gaps), we will be able to discern one as a continuation of a trend and the other as a climax top whereby prices reverse.
3. Crossing above and below the 0
I am adding in the third method to trading the PVO only because other sources recommend it. However, I have put it here to strongly recommend against using 0 crossovers to buy and sell. I have not seen a strong correlation between the 0 references and buy and sell signals. This should be avoided.
Final Word on PVO
Trading the Percentage Volume Oscillator is not as easy as it first seems. One needs to have a strong grasp of market cycles to comprehend what the PVO is telling him. That having been said, it is a good alternative to visually looking at the volume bars and trying to determine an increase or decrease in volume. While some prefer to do everything by hand, using the PVO will give a good visual clue when volume is spiking and the trader should be alert.