The Relative Strength Index was developed by J. Wells Wilder in 1978. It is one of the more popular momentum tools in use today. This is not to be confused with Relative Strength measurements by a similar name used by John Murphy or popularized by William O’Neil. Those calculations often refer to how well a stock is performing against a known index and this is not the type of RSI we are discussing here.
Calculating the Relative Strength Index
While it is not our goal to create the RSI from scratch, a brief overview of what makes the RSI tick would be beneficial.
RSI Formula = 100 - (100/1 + RS)
While the formula seems a bit confusing, suffice to say the goal is to graph the RS or the Relative Strength. The Relative Strength is the average gain divided by the average loss for the specified period.
For instance, imagine we are plotting the RSI using 14 day settings. If the stock rose for 14 days straight without a down day, the RSI would be 100. If the stock dropped 14 days straight without rising, the RSI would be 0. By comparing the up days to the down days, we can determine the Relative Strength of the stock. That is enough about the formula. We will now move on to what it looks like graphically.
Plotting the RSI
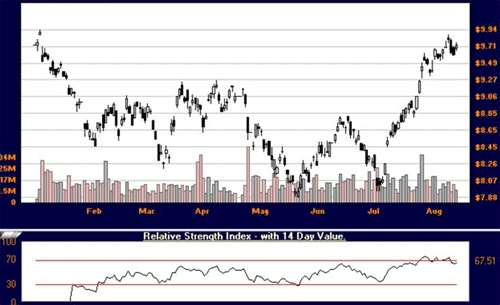
Inside the indicator box, the RSI will be plotted between 0 and 100. As well, there are usually bands present at 20 and 80, or 30 and 70. These two lines represent oversold (20 or 30), and overbought (70 or 80) levels.
BHP with RSI indicator

Interpreting and Trading the RSI
Trading the RSI profitably is what separates the good traders from the bad. We will now discuss a few common methods of trading the RSI.
Common Methods of Trading
- Overbought / Oversold levels
- Divergences
- Centerline Crossovers
Overbought and Oversold Signals
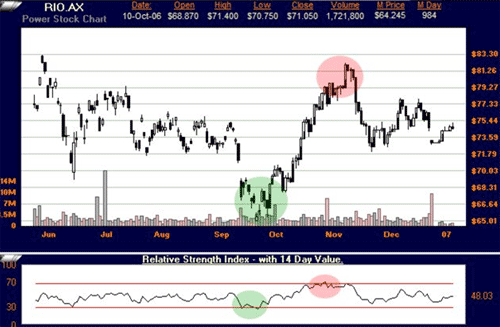
This method is quite simplistic. When the RSI rises above 70, the stock is overbought and you sell your position or short sell. When the RSI is below the 30 the stock is relatively oversold. You would purchase or cover a short position at this level.
The idea behind this method is that a stock that has fallen too far/ too fast and will pop back upwards.
RIO with RSI indicator

As can be seen, when the RSI dips below the 30 a buy signal is formed. When the RSI rises above the 70 a sell signal is formed.
There is a very strong warning to be heeded with this type of trading. This style might work in a sideways market where prices are swinging up and down, but in a heavily trending market there are fewer ways to get financially wiped out then trading this way.
A stock will drop and the trader feels it is oversold and he purchases. The stock may continue to plummet. Or a stock rises and the trader sells. The stock might continue to trend upwards without the RSI trader profiting from it. This style of trading should only be used in sideways markets or in conjunction with other signals.
Divergences with the RSI
Divergences are a strong trading signal, although a little more difficult to find.
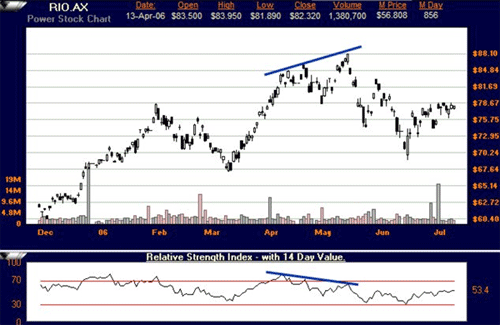
- If the RSI is dropping while the stock prices are rising, the direction of the stock might reverse downwards.
- If the RSI is rising while the stock is dropping, the direction of the stock might switch to up.
RIO with RSI Divergence

Note how the RSI was dropping even while the prices on the chart continued to increase. The prices reversed and dropped. While divergences are not always easy to spot, they are often quite profitable.
Centerline Crossovers with the RSI
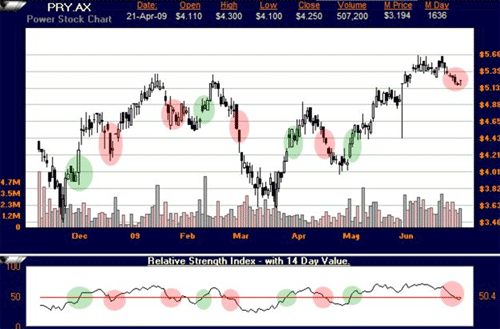
Another method to trade the RSI, although a weaker one, is to trade centerline crossovers. When the RSI rises above the 50, a signal is generated to buy. When the RSI falls below the 50 the signal is to sell.
This method may not generate the strongest signals on the market, but it is safer than using oversold and overbought levels. The reason is that if you buy a falling stock with a low RSI, you may not get a sell signal. In fact, the stock could go bankrupt without a valid sell signal.
If you purchase when the RSI rises above 50, at least you will get a sell signal when the stock falls and the RSI moves below the 50. In this respect you are choosing smaller profits but a safer method.
PRY with RSI crossovers at 50 reference point

As can be seen in the chart above, RSI crossovers can generate a vast amount of signals, and not all are very profitable trades. Still, with a clear entry and exit signals, this method will always give a signal pair.
Using RSI with Other Indicators
In the strategy section we will cover how to combine indicators to form a solid game plan. Suffice to say at this point, we want to trade the RSI with other indicators for confirmation. We can use RSI with trend following tools, but more often with volume tools to validate a signal.