Another very popular tool in the trader’s tool belt is the Stochastics indicator. The Stochastic Oscillator was developed by George C. Lane in the late 1950’s. The goal of this momentum indicator is to determine if the stock price is in the upper or lower trading range over a set amount of time.
Calculating the Stochastic Oscillator
The Stochastic Oscillator has two basic components: %K and %D. We will describe the Stochastic Oscillator with a typical setting of 14 days or periods.
Below is the Stochastic Oscillator Formula for %K

The formula for %D is a moving average of %K, typically 3 days.
While this might seem like a complex lesson in Greek, what is the aim?
Imagine that the stock traded between 0 dollars and 10 dollars within the last 14 days (ie 14 day settings). This seems impossible, but we will imagine it is true.
If the stock is trading at 5 dollars today, the stochastic reads 50. If the stock is trading at 10 dollars, the Stochastic Oscillator reads 100, and so on. This is what %K is.
%D is just a moving average of the Stochastic Oscillator. You are now welcome to forget this if you wish.
Would You Like That Slow, Fast, or Full?
The Stochastic Oscillator comes in three variety packs: slow, fast, and full. To explain the differences, it might be quicker to simply look at what a slow and fast Stochastic Oscillator look like.
Fast and Slow Stochastic Oscillator
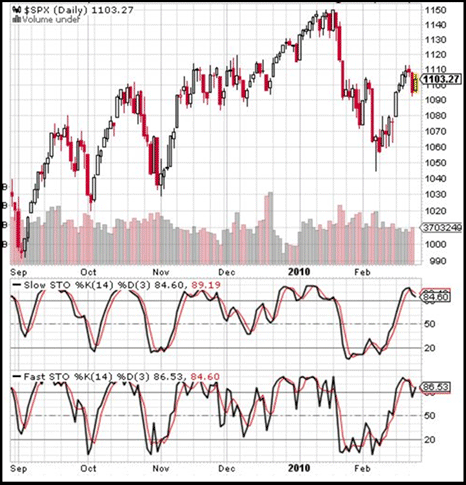
Directly below the price chart is the slow Stochastic. At the very bottom is the fast Stochastic. Note that while they are performing the same overall pattern, the fast Stochastic has many more jagged lines in it. The thick black line is the %K Stochastic while the thin red line is the %D.
With the fast Stochastic, there are too many whipsaws. This might be useful for someone able to screen out false triggers, but for others it was simply confusing. The slow Stochastic was developed that simply averaged the data over 3 days. (Interestingly enough, the thin red line or %D on the fast Stochastic is identical to the thick black line or %K on the slow Stochastic).
So while these two oscillators are trying to give you the same overall answer, one is much more sensitive than the other. But what of the full Stochastic? By adding in one other parameter, the full Stochastic is able to mimic the fast, the slow, or a variety of other settings. For our purposes of having clean signals with as little complication as possible, we are sticking to the slow Stochastics.
Trading Signals with the Slow Stochastics
As is true with the other momentum indicators, there are three basic ways to trade the Stochastic Oscillator:
- Divergence from share price
- Crossover with signal line
- Overbought and oversold levels
1. Divergence from Share Price
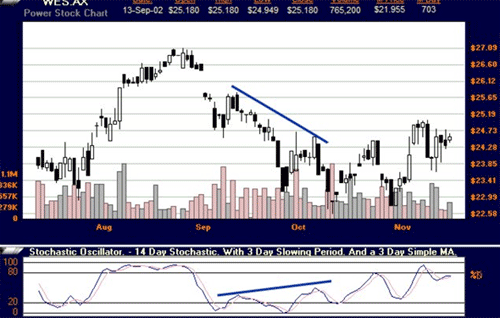
When the Stochastics Oscillator is moving in a different direction than the price, the trader should take note and prepare himself for a potential price change. In this regard, patience is necessary as it may take weeks or more for the price to follow. Divergence is one of the more rare signals but perhaps one of the strongest.
2. Crossing With the Signal Line
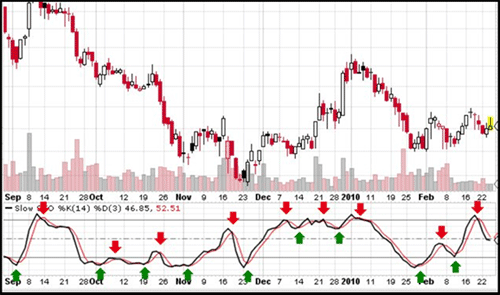
The Stochastic Oscillator has a signal line. Similar to the MACD, when the Stochastics rises above the (%D) signal line a bullish signal is formed. When the Stochastics falls below the signal line, a bearish order is given.
This type of trading generates many signals and much whipsaw action can occur. As you can see on the chart below, there is a glut of signals in the 6 month period, and not all of them very profitable.
3. Stochastic Overbought and Oversold Levels
This last method is very similar to the RSI method. When the Stochastic Oscillator falls below either the 20 or 30 value, this means the stock is oversold and a good buying opportunity may be present. When the Stochastics are above 70 or 80, the stock is relatively overbought and the prices may correct.
Let me reiterate the warning: this is best in sideways trading markets and not for trending markets. In the chart below you can clearly see how buying a stock as its falling, just because it appears to be oversold, is a disaster. The first buy signal generated is followed by a price drop of over 20 percent.
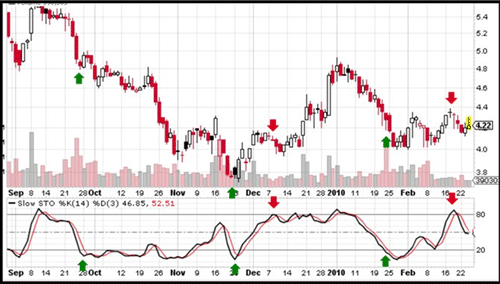
Follow this one simple tip to turn a substandard oscillator trade into an expert one: buy when the stochastic stays below the 20 for at least a couple of weeks and then rises above it. Short or sell when the indicator stays above the 80 for at least a couple of weeks and falls below it. While still holding to the ideology of overbought and oversold levels, you are merely waiting for the stock to confirm that its changing direction.
HOT TIP
- Short or sell when indicator falls below 80
- Buy or cover when indicator rises above 20
I have outlined in purple (below) the signals just using overbought and oversold levels. The first purple arrow is a sell or short signal and the second is a buy or cover signal. In green and red I show the advanced ‘confirmed’ method of trading the overbought and oversold levels. Notice the superior entry and exit values.
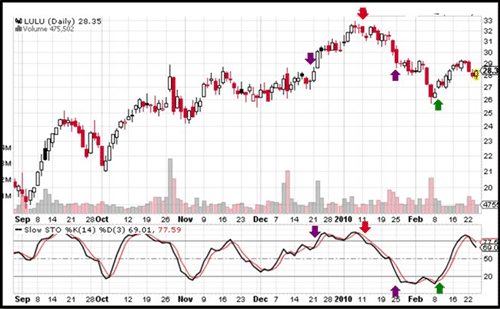
Trading the Stochastic Oscillator
Comparing today’s prices to a previous trading range, the Stochastic Oscillator can give decent signals. However, caution is always warranted with any momentum indicator since in the wrong hands it can be harmful. If used wisely with other indicators such as volume this can be a strong trading tool.