Perhaps one of the strongest concepts in technical analysis is support and resistance. The stock market is one massive pool of traders playing the game of supply and demand. When there is more shares for sale than buyers, prices dive with an abundance of supply. When more buyers are present than stock available, demand drives prices up.
The stock will oscillate between supply and demand swings numerous times throughout the year. There are little supply and demand swings that can be plotted using various technical indicators or charting tools such as a trendline. We will discuss a more absolute value of support and resistance in this article.
What is Support?
Support is a price level below a stock that it has previously bounced off before. A stock making new all time lows does not have historical support below it.
Finding a support level is a mix of science and art. Usually you will not find an exact price that the stock bounces predictably off every time. More often you will discover a price range that acts like support.
What is Resistance?
Support and resistance are exactly the same lines; it just depends on which side of the line the price is currently on. If the stock is above the line, it is support; if the price is below the line, it is resistance.
To find the support and resistance line, find the prices that the stock has hit from the underside and retreated from, and once on top of has bounced off like a trampoline.
Drawing the Support and Resistance Line
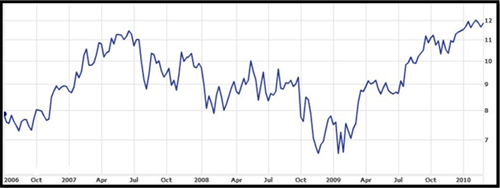
To find the support and resistance, call up a one year or longer chart on the desired stock. Draw a line horizontally one the chart where prices hit and react. Examine the following 4 year chart for CPU and try to pick out key support and resistance levels.
4 year chart for Computershare LTD (CPU)

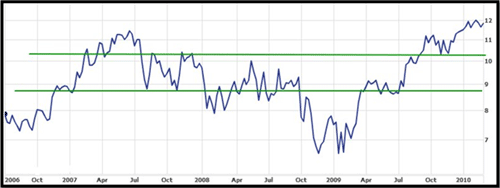
I have identified just two such areas on the chat below, although there are more. For instance, another support and resistance level exists just above 11 dollars.
4 year chart for CPU with support and resistance levels

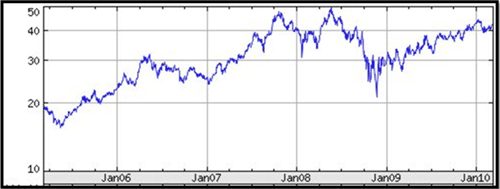
Interestingly, you will often find support and resistance at whole dollar values, and at larger multiples such as 10 dollars, 20 dollars, and so on. Look at the chart for BHP below and notice how support and resistance levels are present at 20, 30, 40, and 50 dollars.
BHP Billiton (BHP) with obvious support and resistance levels

How Do You Trade Support and Resistance?
There are a few ways we can trade support and resistance. You can use them as absolute buy and sell triggers or you can use them to merely suggest possible trades.
Here is an example of a potential exit signal with support and resistance levels using BHP. You purchase the stock at 35 dollars. You know that 40 dollars is resistance. As the price rises and nears 40 dollars you look to your other technical indicators for a breakdown of trend. Or you short the stock at 37 dollars. As the stock heads toward 30 dollars you will want to carefully watch the stock to know if that is a good level to cover at.
These also create excellent buying signals. When a stock rises above a strong support level and bounces along it, this creates a safer buy point. Some examples on the above chart are 2005 at 20 dollars, 2007 at 30 dollars, 2009 at 30 dollars, and 2010 at 40 dollars.
The same is true for shorting. If a stock this resistance and begins to fall, this makes a fairly safe level to short at. Some good examples on the stock BHP are 2006 at 30 dollars, 2007 at 40 and 50 dollars, and again in 2008 at 40 and 50 dollars. Some of the short plays are very profitable but short in time frame.
Trading the Ranges
Another way to trade off support and resistance is to play the ranges. This often works best in a sideways market, although variations can be made using trading channels off the trendlines.
Trading a range is quite simple once the established support and resistance zones are in place.
Below is a chart for the stock RIO.AX. Some major support and resistance levels are colored in green. Some minor support and resistance levels are colored with blue lines.
Historical chart for Rio Tinto (RIO)

Now that the trading ranges are in place it is quite easy to see some profitable buy and sell points. Of course, I rarely recommend trading support and resistance levels exclusively. They are best used as clues as to what potentially may occur at certain levels. You should make the actual decision to buy and sell, or short and cover, once you are in the action and responding to volume, momentum, and trending signals.
Final Word on Support and Resistance
Picking support and resistance levels can be tricky at times. It is visually showing you psychological levels where a flood of buyers or sellers (demand and supply forces) exert their strength in the market tug-of-war.
While we draw support and resistance as exact lines, it may be that the support is a range of values (e.g. 9.50 to 10.20).
Support and resistance are great clues as to profitable entries and exits, and particularly powerful when combined with other indicators in a complete trading strategy.