Developed in the 1980’s by Jack Hutson, the TRIX indicator has become a well used method for momentum traders to determine buy and sell signals. For those interested in technical jargon, it is a graphical display of the rate of change of a triple exponentially smoothed moving average of the security’s closing price. So much for definitions clearing up what a word means.
Calculating the TRIX Value
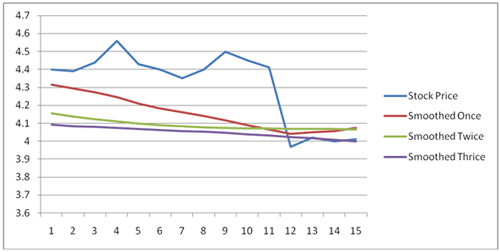
For those interested in how the TRIX value is derived, read this next section. If not, just skip down to how the indicator is used. There are four basic steps to arriving at the TRIX value. We will use the common default setting of 15 periods and a 9 day trigger line.
- Use a 15 day exponential moving average of the shares closing price
- Based on that moving average, perform yet another 15 day moving average
- Take step #2’s moving average, and perform a third moving average
- Now calculate the 1 day percent change with the triple smoothed moving average
The goal is to super smooth the data security to reduce the volatility and whipsaws.
Rising and Falling TRIX Values
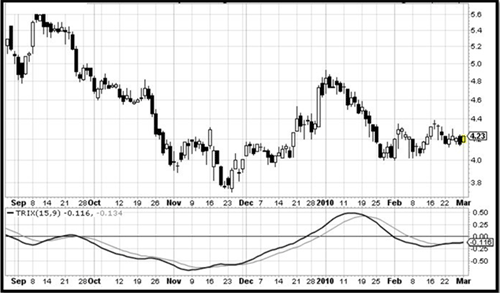
Because the TRIX value is calculated from the closing prices of the security, the rising TRIX is directly related to the rising closing values of the underlying shares. Likewise, when the TRIX value falls, this is linked to the falling values of closing share prices.
Chart displaying correlation between share price and TRIX
Methods of Trading TRIX
As is true with many of the momentum indicators, we can trade based on divergences and crossovers.
1. Bullish and Bearish Divergence
Sometimes the TRIX will be turning down while the share prices are still trading up. This would be an early indication that the prices may reverse. Or the TRIX may be turning upwards while the share prices are trading down. This may indicate a future positive move with the asset trading value.
Price chart showing divergence between TRIX and asset trading
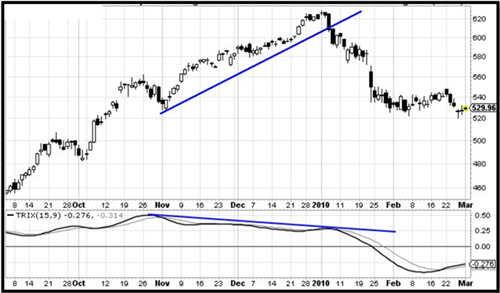
Divergences are generally considered the strongest of trading signals, although they are usually the most difficult to find. The following two methods are some of the more popular and easy to discern.
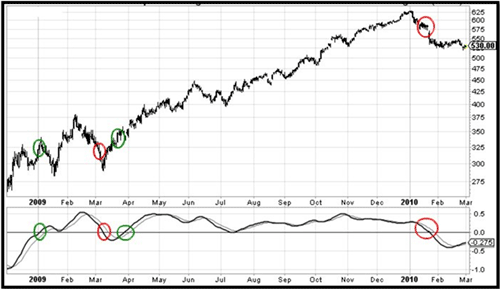
2. Crossovers with 9 day signal line
Notice how in the TRIX indicator box on the bottom, there is also a more faint line. This is the shorter period moving average used as a signal. When the thicker dark line rises above the signal line, this is a bullish indicator to buy. If you see the TRIX fall below the signal line, this is a suggestion to sell.
Chart with TRIX showing crossover trading signals
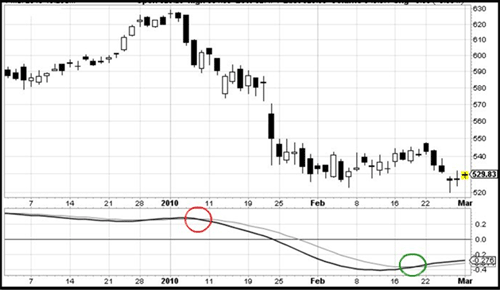
The above chart with TRIX has a red and green circle. These can be translated into a sell and a buy order, or a short sell with a cover order depending on your overall sentiment.
Keep in mind that crossovers will generate more signals than divergences. The strength of each generated signal is subsequently less important than a divergence. Nonetheless, many traders like the simplicity with such a trading signal.
3. TRIX crossover of the 0
Another simple method to trade the TRIX is to buy when it crosses above the 0 and to sell when the TRIX falls below the 0.
feel that a couple of personal warnings are warranted with this method. This style of signal is not very profitable when the stock is trading up and down with great volatility. That is to say, if a stock moves with large swings, this may lose you large amounts of capital in the long run. TRIX crossovers on the 0 are best for stocks that have strong fundamentals and there is a long trend expectation.
Chart with TRIX crossing above and below 0
Final Word on Trading the TRIX
The TRIX indicator is excellent for filtering out unwanted noise and misleading short term price movements in a chart. It helps the investor see the ‘big picture’ of what is happening. As well, it has an advantage over moving averages since the fourth step in calculating the TRIX turns this from a lagging to a leading indicator making it fit for momentum buying and selling. As well, it excels at giving indications when a bear trend is about to turn bull, or when a bull trend is about to reverse into a crash.
There are many custom settings for the TRIX such as 30 periods and 15 periods. You should make sure the TRIX setting you are using fits with the trading strategy you are following.
Get to know how the TRIX works with its many signals to rank up there with the professional traders.