Just One Trade
We will walk through a trade as to how our thinking process works and the considerations a daytrader needs to make. We start by scanning for highly liquid stocks in the S&P 500. Finviz.com is an excellent free resource for this. Click on the Screener tab and make sure you enable all of the possible filters.
The criteria we select is as follows:
- Index: S&P 500
- Price: $10 to $50
- Average Volume: Over 2 million
- Average True Range: Under 0.50
Average True Range will give you the average price volatility during a day. If we select under 0.50 this means that the daily range (but it also includes overnight gaps) will be less than 50 cents. You can manipulate this number if you want volatile stocks or quiet ones. We will begin with less than 50 cents so as to limit our volatility risk. We have 72 stocks to choose from as of time of writing. This allows us a lot of choice and even more so depending on your ATR setting.
El Paso Corporation is one stock with volume ranging between 5 and 20 million over the past few months. It is in an uptrend with some decent price moves lately. The chart below is for February 29th, 2012.
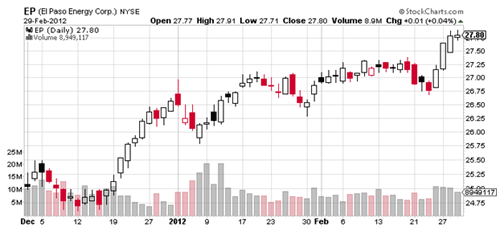
Our trading will begin on March 1st. We will have little long-term bias and take each day fresh – but I can’t help but notice the nice uptrend and recent heavy accumulation with price advance. Next, I look over the past couple of trading days and plot in recent support and resistance levels.
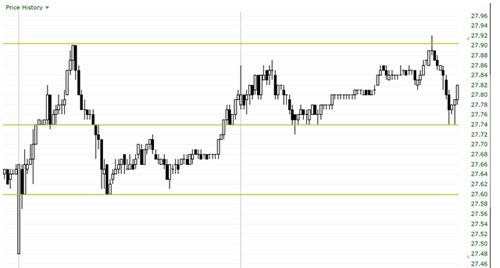
Looking at just two days of trading we have support at $27.60 and $27.74 with resistance at $27.90. These are some key levels to watch for the March 1st trading day. To better show the volatile morning trading session we will look at the 1 minute charts for March 1st. Keep in mind we need to trade off the 5 minute charts. I am using 1 minute charts for illustrative purposes to show the volatile morning action.
Notice how the trading opens in the first minute on March 1st.
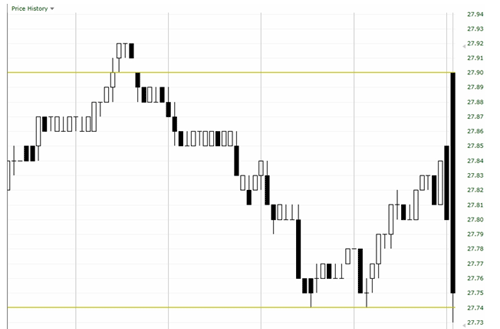
Remember that we are using 1 minute bars. The very last bar on the screen is the first minute of trading on March 1st. Prices opened up at our resistance level and fell all the way down to our support level inside 60 seconds of trading. Prices pulled up two cents as the first minute closed at $27.75. We are simply sitting and watching at this point – no trading allowed! Two key levels have been tested and this sets up an interesting day. Which of these two levels will be breached first? Will $27.74 hold as support or will we have a flurry of downward trading? Let’s look at the next 5 minutes.
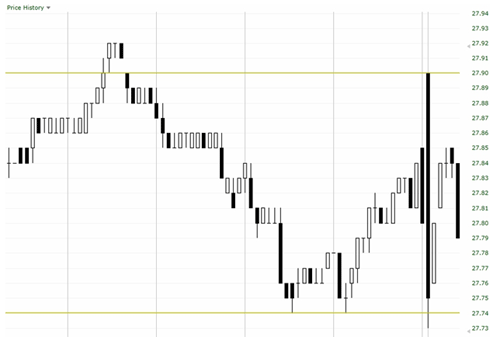
We are 6 minutes into the day watching as to what this stock will do next. We have a bounce up for a couple of minutes, two minutes of stalled trading followed by a sharp move down. At this point we could have either an uptrend or a down trend. What will the first 15 minutes reveal on our 1 minute chart?
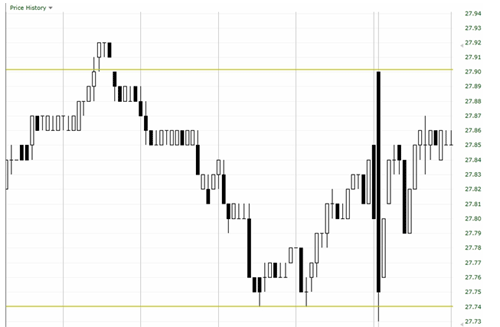
The case is being built for an upwards trend. Still, we have some resistance at $27.90 and it would be prudent to see how prices react at that level before going long on a possible uptrend. As well, we trade the 5 minute chart as there is too much noise here. Let us now look at the first half-hour of trading on the 5 minute chart below.
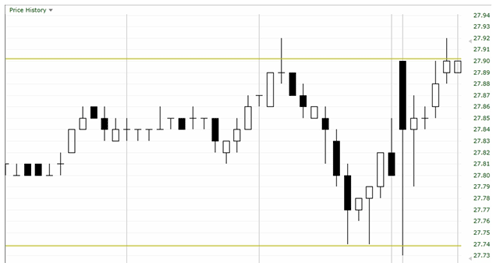
The trading day of March 1st begins on the 5 minute chart with the tall black bar near (6th bar from the end). The last two bars on the chart represent trading from 9:50 to 10:00. These two bars hit the resistance point of $27.90 and stall. In the second to last bar on the chart, which represents 9:50 to 9:55, prices briefly spike past $27.90 for about a minute (I consulted the 1 minute chart for verification). I am building a bullish bias but am waiting to see if resistance will be broken. With only a little over 20 minutes into the day with resistance broke I do not trade. I want to see further evidence of an uptrend. The trend is too steep with not enough time passing to form a solid trend. Prices poke back down after one minute below the resistance level.
At this point I look back to my 1 minute chart to see what the 10 and 20 exponential moving averages are telling me. The 1 minute chart below will only show March 1st trading action starting at 9:30.
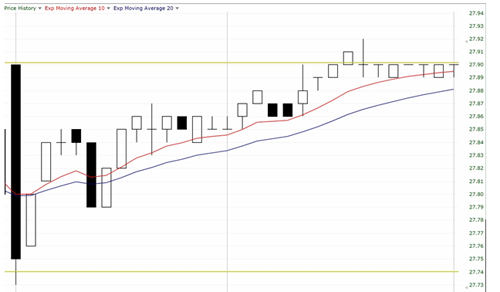
The 10 period ema is above the 20 period ema. We should have a bullish bias at this point in time – but we must always be willing to change our bias on a moments notice. With this bullish bias I am preparing to enter on a possible breakout past resistance. We go back to the 5 minute chart to draw a trendline and watch the price action at the resistance level.
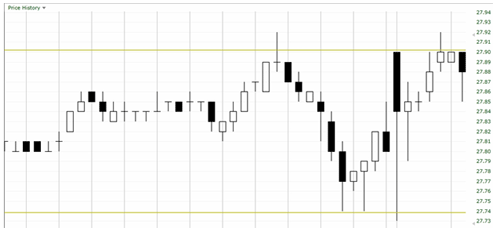
The last 5 minute bar shows that some selling and shorting is taking place at resistance. Prices spike down to $27.85 but pop back up to $27.88. What do we need to consider when buying? Our two bar trading rule states that we must have a high that exceeds the high of the bar previous. If the next 5 minutes gives us a price of $27.91 we might be able to draw a trendline and have our entry point which is higher than the previous high.
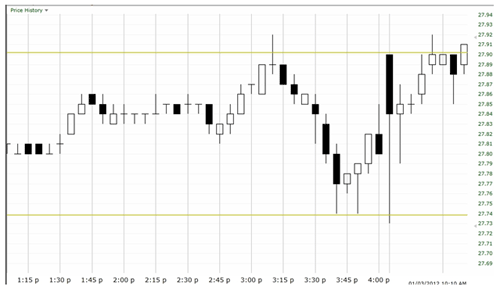
Prices go above and we can buy at $27.91. Some will look at this and suggest that the absolute highs of $27.92 need to be broken first. Resistance levels often come in ranges and not exact penny amounts. I placed my ‘best fit’ resistance at $27.90 and am going to stick with it. If you placed yours at $27.92 – so be it. But don’t get in the practice of moving your entry higher and higher as at some point you need to pull the trigger and waiting until prices are too far extended is not wise.
We have an upwards bias and prices breaking above our resistance level. Next we need to consider trendlines, exits and more which is covered in part 2.