In the first half of this two-part article we screened for a suitable stock, looked at previous support and resistance levels and formed an upward bias based on the 10 and 20 period moving averages on a 1 minute chart. Next we want to look at trendlines as well as the 10 and 20 period moving averages on the 5 minute chart.
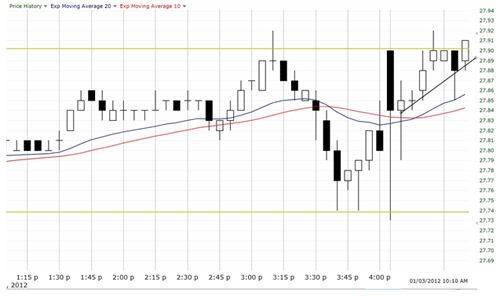
Drawing a trendline will be challenging as the first 5 – 10 minutes had extreme volatility. I will tentatively draw a trendline that will surely need some adjustment going forward. I will also add the 10 and 20 period exponential moving averages to my 5 minute chart as potential support (or stall) zones.

The 5 minute chart above shows my initial attempt at drawing a trendline. I ignore the first 5 minutes of trading and placing my trendline under the candle bodies instead of the wicks as trading was simply too volatile to accept the full range. I have little doubt that my trendline will need adjusting as more trading unfolds. I also have two moving averages on the 5 minute chart which don’t show me much other than one quick spike down to the 20 ema before reversing.
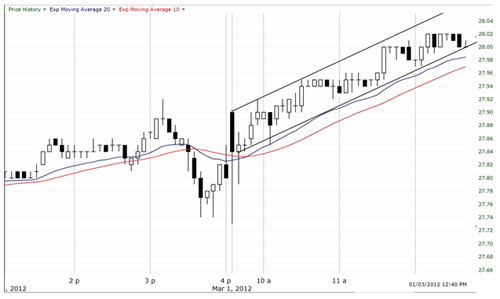
In the 5 minute chart below I will remove the horizontal support and resistance lines to unclutter the trading action. I have modified my trendline slightly to follow prices more accurately. I have also created a channel which is a second trendline of identical slope which is placed above the trend.

Recall that we went long at $27.91. This is a slow moving stocks and after a couple of hours we are up 9-10 cents. We knew we were picking a slow moving stock since we screened for stocks with 50 cents of daily volatility or less. We have already witnessed a 30 cent range so we won’t be expecting too much of a massive move from here. When will we sell this for profit?
If prices shoot up past our upper trendline in runaway mode we can sell using the two bar rule (sell when current bar trades lower than previous bar). We might need to sell in that manner if prices soared 50 cents inside of 30 minutes but that doesn’t appear to be the case here and neither do we expect it based on our average trading range. Another exit would be a breakdown of our upwards sloping trendline. If prices fail to channel upwards and fall, our trend is finished for the time being. We should also consider the 10 and 20 period moving averages on the 5 minute chart for possible support bounces.
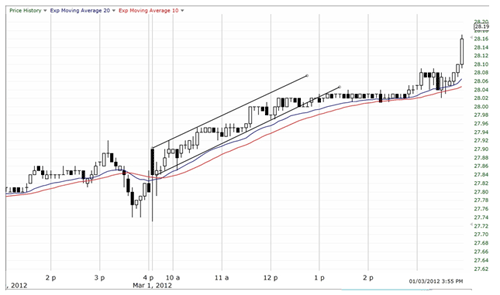
Consider the 5 minute chart below.

The trendline was breached from one o’clock onwards at a price ranging from $28.01 to $28.03. This is our first selling point. Some may have held onto the trade as they used the 10 and 20 period moving averages as support zones. I would have exited after the trendline was broken, but that is just me – others would wait.
First selling target yielded 10 to 12 cents of profit.
What if you held? You may have been shaken out when prices dipped down near the end of the day for a similar exit as our first one. Or you may have simply held for a small scalp of a few cents profit. Some may have held all day to see where this was going as the moving average support zones generally held.
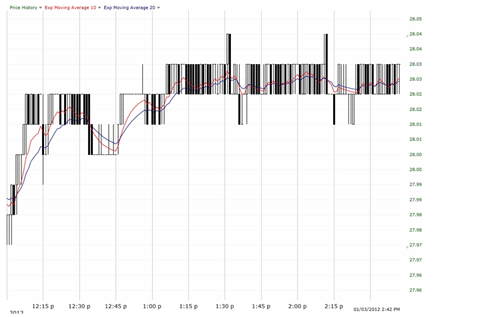
What about using the 10 and 20 period moving averages on the one minute chart? Because the prices on this stock are moving so slowly, the strength of the moving averages are rendered moot. The stock is trading up a penny and down a penny with these short-term moving averages trading in a whipsaw fashion with no real value.

This is another reason why I use 1 minute charts as an aid but not as a rule.
That will sum up the trading rules. Let’s quickly review how to create a bias:
- Watch the first 30 minutes of trading to determine a trendline bias
- Look to the 1 minute chart moving averages (10 and 20 period) to develop a bias
- Look to support and resistance levels of past 2 days and plot them on the chart
- Be willing to change your bias on a moment’s notice
The trading trigger:
- Wait for prices to bounce off support or break through resistance before buying (if prices are near those levels – if not just ignore it)
- Wait for prices to pullback and take out previous high (low) when buying (shorting)
- Immediately draw a trendline after the above step
Possible places to sell:
- The trendline is seriously breached
- The 10 and 20 period moving averages cross on the 1 minute chart
- In a runaway trend – sell using the two bar rule (when a 5 minute bar goes below (above) previous bar when in a long (short) trade)
- Look to the 10 and 20 period moving averages on the 5 minute chart as potential support zones for bounces. If these are seriously breached you may want to exit
- For short-term exits consider using the upper and lower boundaries of your trading channel
- Sell (buy) when prices near resistance (support) after having a profitable run
There is so much more to trading such as watching bars in real-time and seeing them turn from a nice bull candle into a horrible bear candle in the period of 10 seconds. There are headfakes, periods of low volume trading and so much more. These are some basic price trading guidelines that you can use to stay in the game long enough to put a few pesos in your account while you learn but do not become self-satisfied with these brief rules. Your journey has only begun.