The next three part article series will be dedicated to trend following indicators. Being able to identify a trend is one of the most important concepts in technical analysis.
What is a Trend?
A trend is the general direction of share price. Trends are often classified as:
- Up trend
- Down trend
- Sideways trend (or trendless)
Much like they sound, and uptrend has a recognizable pattern of share price appreciation over time. The downtrend has noticeable price slippage over time. And the sideways trend has an up and down motion that cannot be described as either up or down.
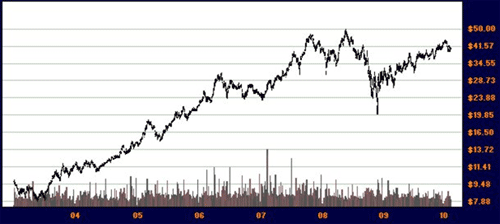
It is also important to realise that the trend is also related to time. You cannot talk about trend without referencing the time frame. BHP shows an uptrend over the previous seven years.
BHP Billiton (BHP) in a 7 year uptrend

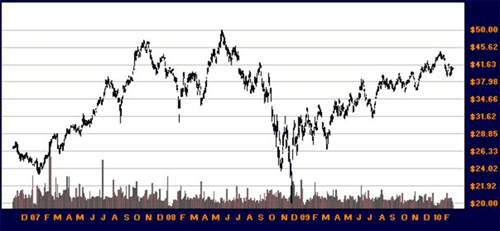
Looking at this same stock over a period of three years, the trend becomes much more difficult to see. In fact, many would consider this to be trendless.
BHP without trend in 3 year frame

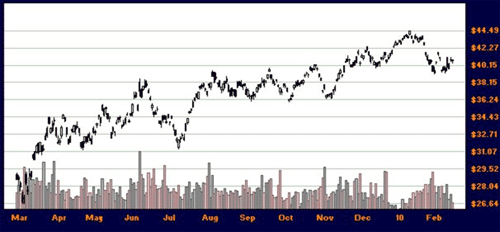
The one year trend is obviously upwards.
BHP with 1 year uptrend

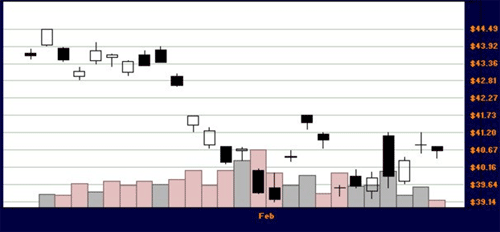
But the one month trend is definitely down.
BHP with 1 month downtrend

Trends are usually categorised into the following time frames:
- Long term trend Spanning over multiple years
- Medium term trend Spanning over months
- Short term trend Spanning over days to weeks
Trading the Trend
An investor should use trend following tools in a trending market. That is to say, if a trader looks at the overall trading pattern and determines it to be sideways or trendless, he would be better suited to using other indicator types. If he identify that the macro-trend is up or down, he may use his trend derivatives to profitably guess future action.
The charting section discussed how to properly draw a trendline. Some traders will buy at the start of a new trend, or at the successive trendline bounces. Once the trendline has been broken, the trader will often confirm with another tool such as volume, and then sell.
Some find the process of drawing trendlines on a chart to be too bias and subjective to personal sentiment. They may prefer to use technical analysis indicators such as the:
- ADX
- Wilders DMI
- Aroon
- MACD
It is these latter indicators we will now discuss further in the following articles.