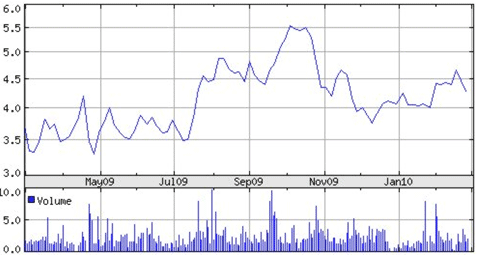
Volume Following Indicators In Technical Analysis
Tracking the price movement of a stock is of key importance in technical analysis. But not to be forgotten is the volume of such moves. Why?
Imagine a stock that trades one million shares per day at the price of one dollar per share. If the stock rose 10 percent on a certain day with only 10 thousand shares traded, would that seem like a strong trend that is likely to continue? What if three million shares were traded at those levels in one day? Volume can either confirm a price move or suggest that the trend is unsustainable.
Stock Market Adage:
Volume Precedes Trend
Volume Precedes Trend?
What does this mean? Usually, a high amount of volume will trade before the price makes a substantial move. A stock might consolidate at a certain level for an extended period before the price jumps. This may occur for a couple of reasons:
- Institutions are playing games to slowly accumulate while keeping share prices down
- The weak hands that don’t believe in the stock need to be shaken out first
- Once available shares become tight, the float becomes smaller and the prices become volatile
Volume Trading Indicators
Many volume trading indicators exist such as the Money Flow Index, On Balanced Volume, Accumulation and Distribution, and the Percentage Volume Oscillator to name but a few. There are many ways to trade volume as well. Some use it as a simple confirmation that volume is behind a trend while others look for divergent patterns that suggest reversals.
Whatever methods are employed to track volume, a careful study into how volume works will greatly improve any trader or investor’s end result.
ALL with simple volume indicator box
